Fig. 2
Download original image
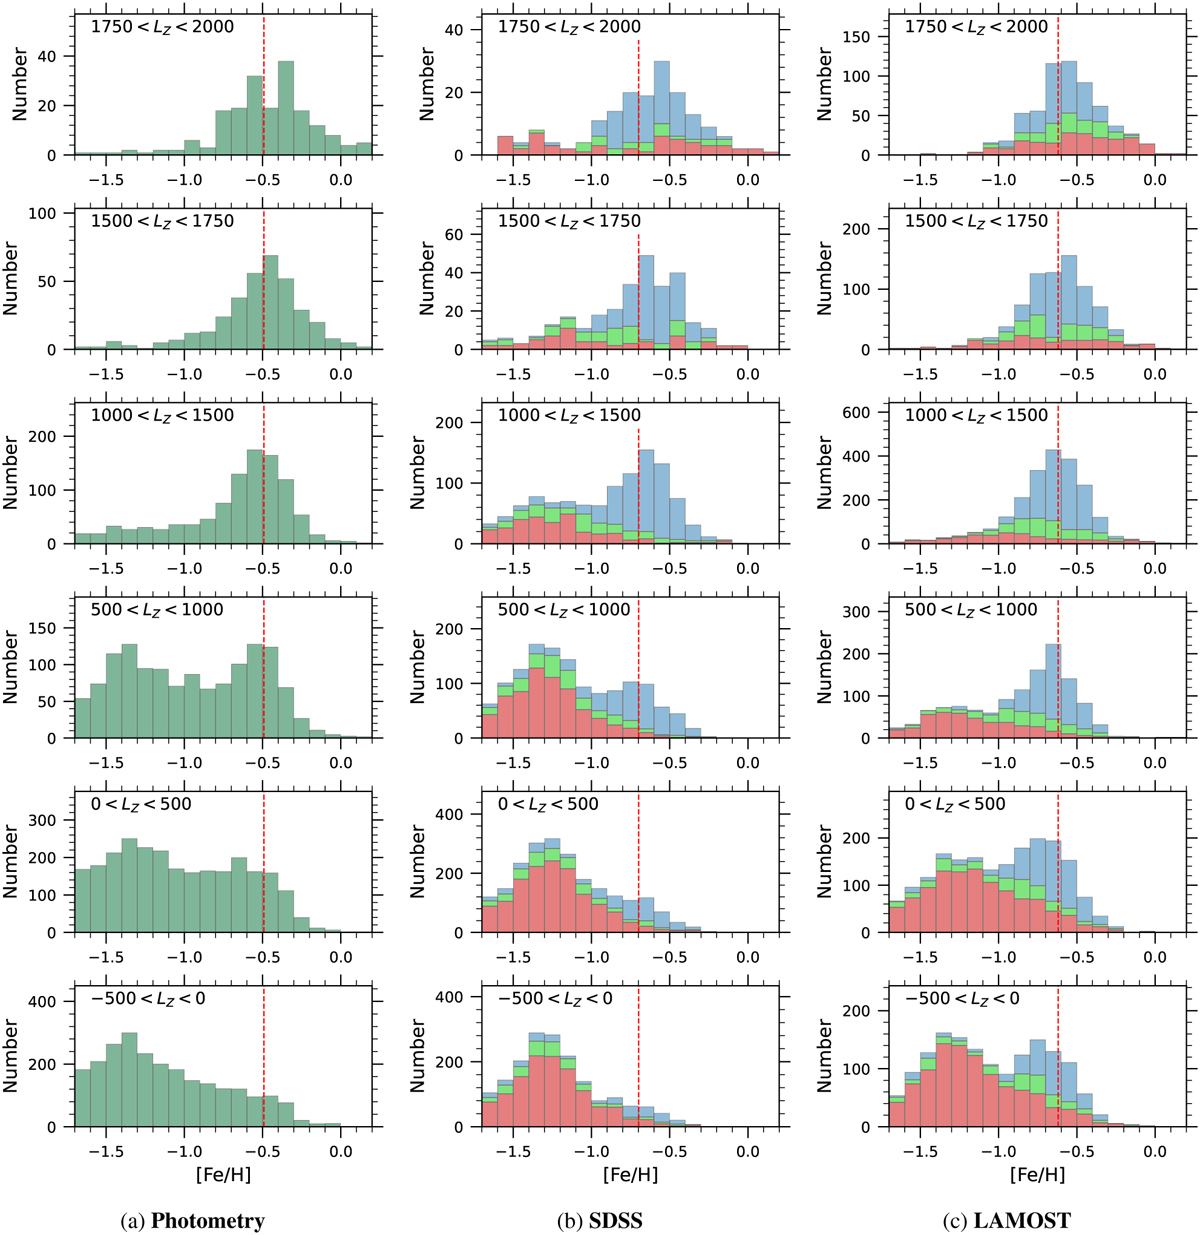
Metallicity distributions of the HPMS samples (Fig. 1) binned by LZ. In all columns except Col. (a), stars belonging to the low-α and high-α sequences are represented by red and blue histograms, respectively, while the green histogram indicates the uncertainty range due to variations in the α-based division (see text for details). To guide the eye, vertical dashed lines mark the median [Fe/H] of all stars within 1500 < LZ < 1750 kpc km s−1 in each sample. Cols. (d) and (e) refer to the high-resolution samples from GALAH and APOGEE, respectively.
Current usage metrics show cumulative count of Article Views (full-text article views including HTML views, PDF and ePub downloads, according to the available data) and Abstracts Views on Vision4Press platform.
Data correspond to usage on the plateform after 2015. The current usage metrics is available 48-96 hours after online publication and is updated daily on week days.
Initial download of the metrics may take a while.