Fig. 3
Download original image
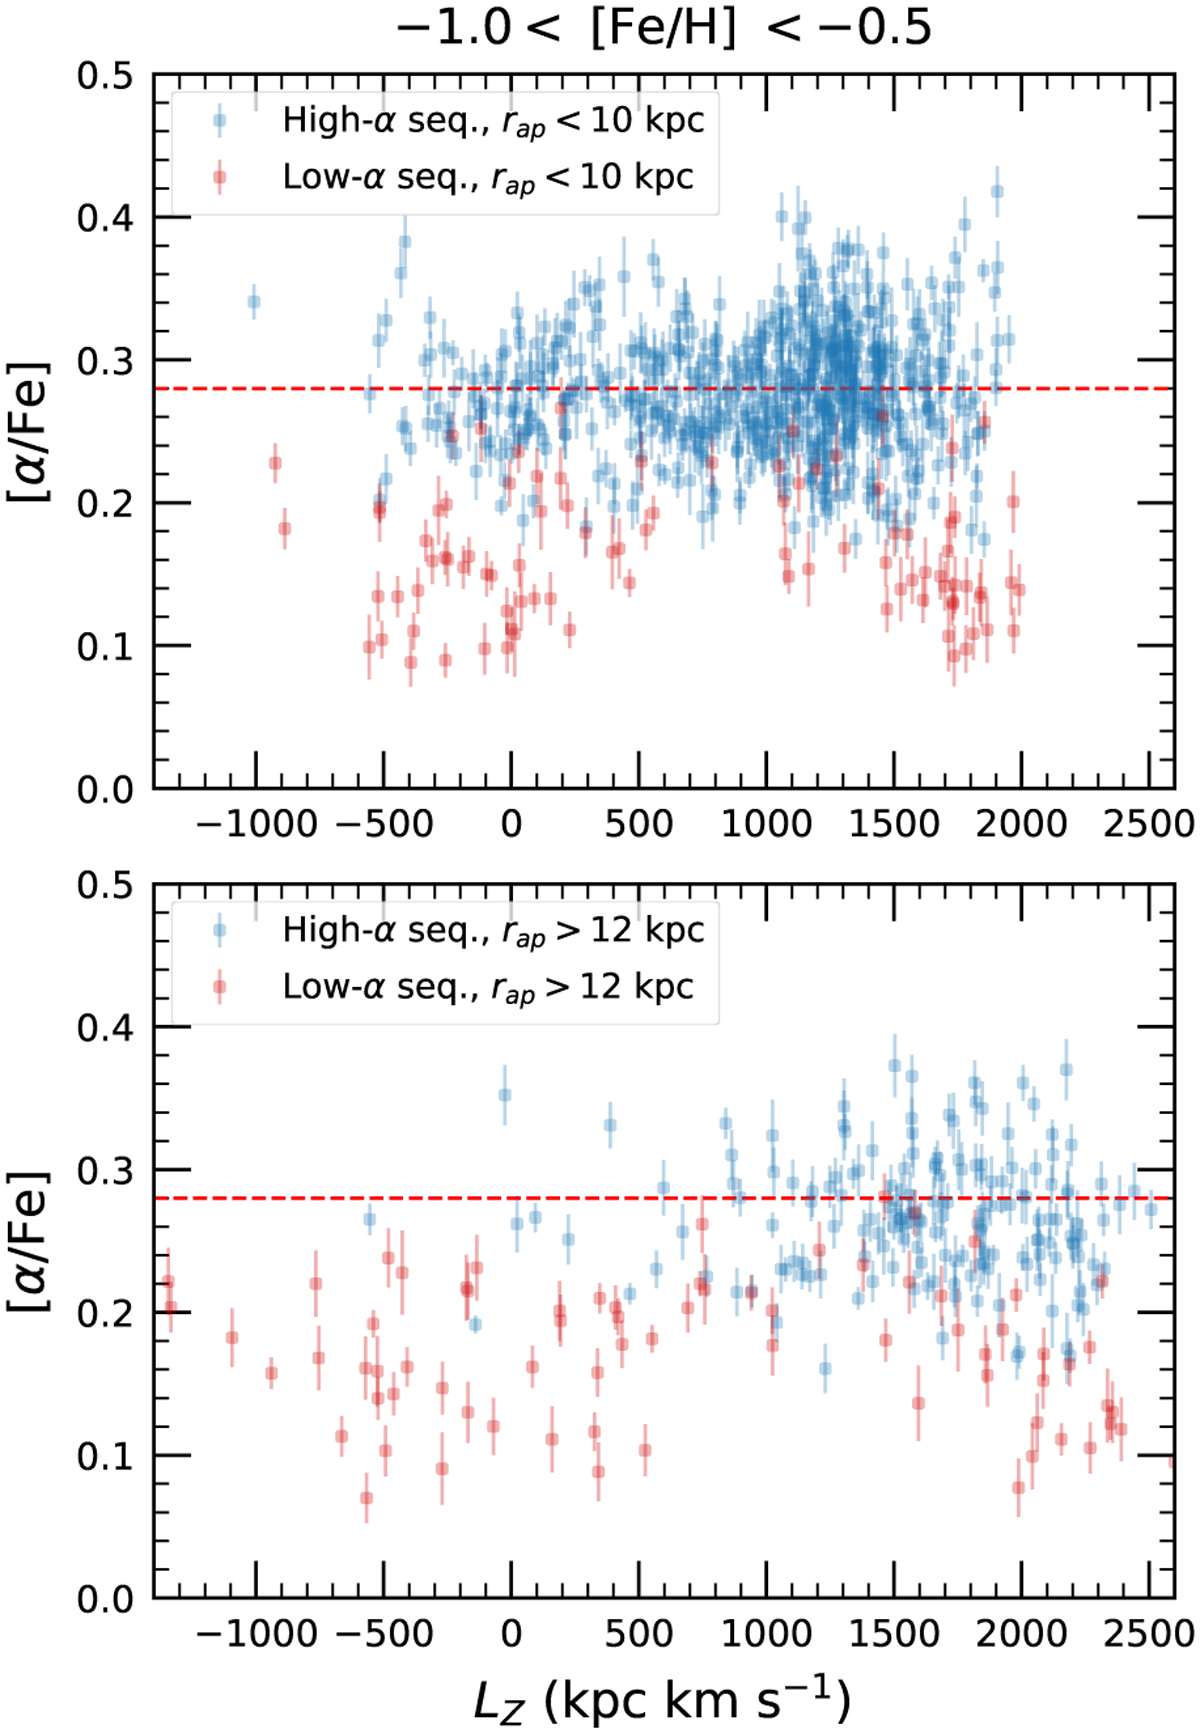
Distribution of [α/Fe] for GALAH stars in the vertical segment of the HPMS (−1.0 < [Fe/H] < −0.5). The top and bottom panels show [α/Fe] as a function of LZ for stars in the inner (rap < 10 kpc) and outer (rap > 12 kpc) regions, respectively. High-α stars are shown in blue and low-α stars in red. The high-α population dominates the inner region and exhibits a relatively constant [α/Fe] over a wide range of LZ. In contrast, the low-α stars display a bimodal LZ distribution: the low-LZ stars are primarily associated with GSE, while the high-LZ stars may trace the high-Zmax tail of the thin-disc population.
Current usage metrics show cumulative count of Article Views (full-text article views including HTML views, PDF and ePub downloads, according to the available data) and Abstracts Views on Vision4Press platform.
Data correspond to usage on the plateform after 2015. The current usage metrics is available 48-96 hours after online publication and is updated daily on week days.
Initial download of the metrics may take a while.