Fig. 4
Download original image
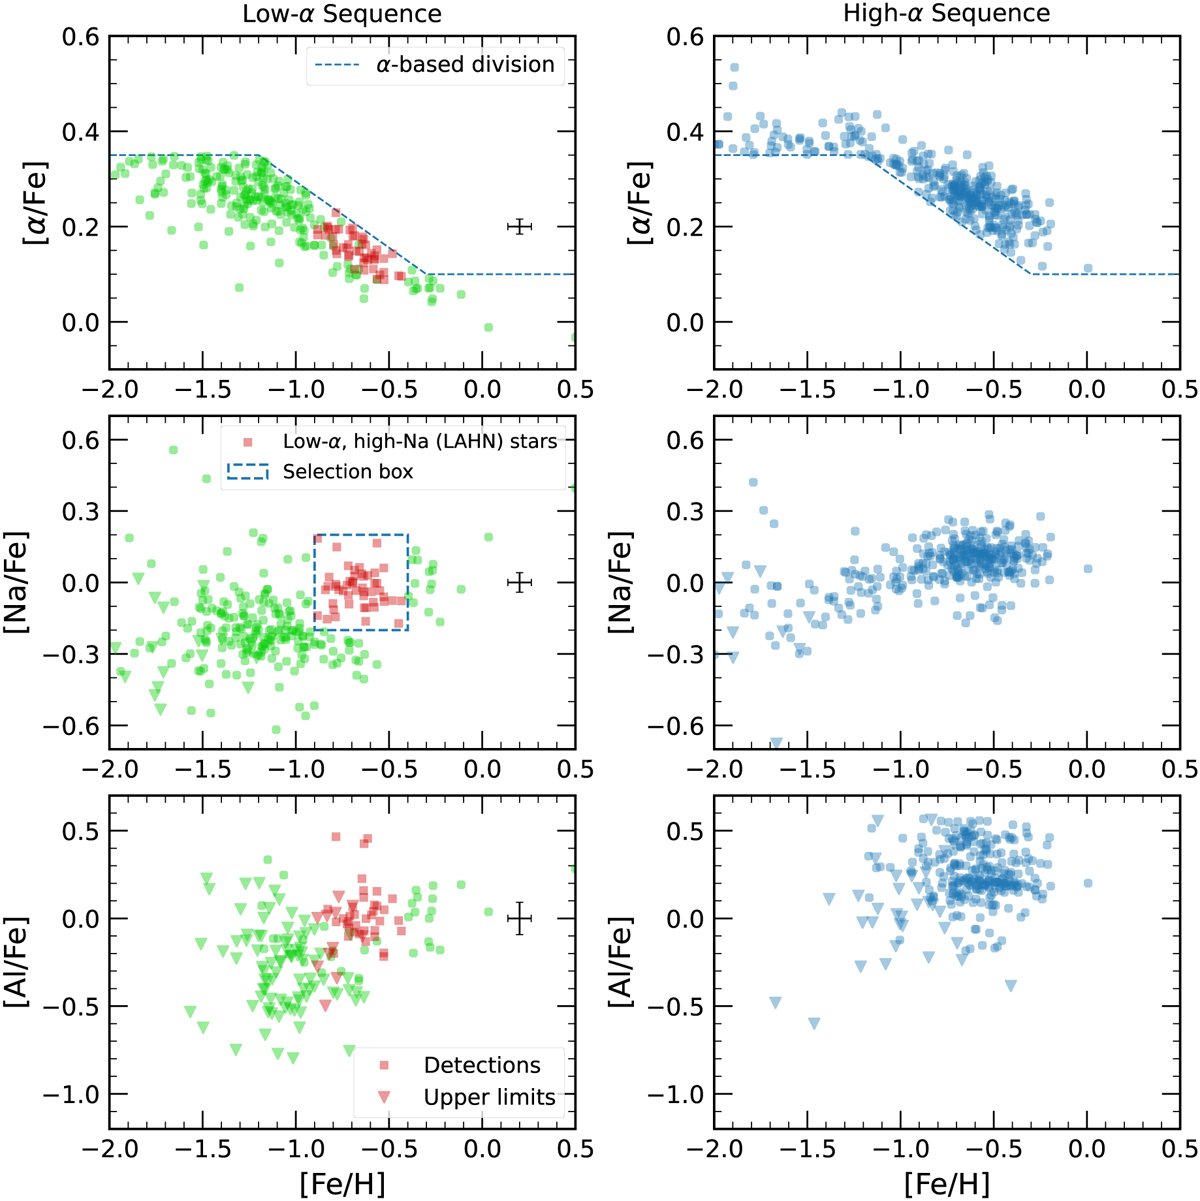
Chemical abundances ([α/Fe], [Na/Fe], and [Al/Fe]) of the GALAH sample with |LZ|< 600 kpc km s−1. In the top panels, the dashed blue line indicates the division based on [α/Fe], separating stars into low −α (left) and high-α (right) sequences. Red squares and triangles in the left column mark low-α, high-Na (LAHN) stars. The dashed blue box in the middle left panel outlines this selection. A representative median error is shown.
Current usage metrics show cumulative count of Article Views (full-text article views including HTML views, PDF and ePub downloads, according to the available data) and Abstracts Views on Vision4Press platform.
Data correspond to usage on the plateform after 2015. The current usage metrics is available 48-96 hours after online publication and is updated daily on week days.
Initial download of the metrics may take a while.