Fig. 6
Download original image
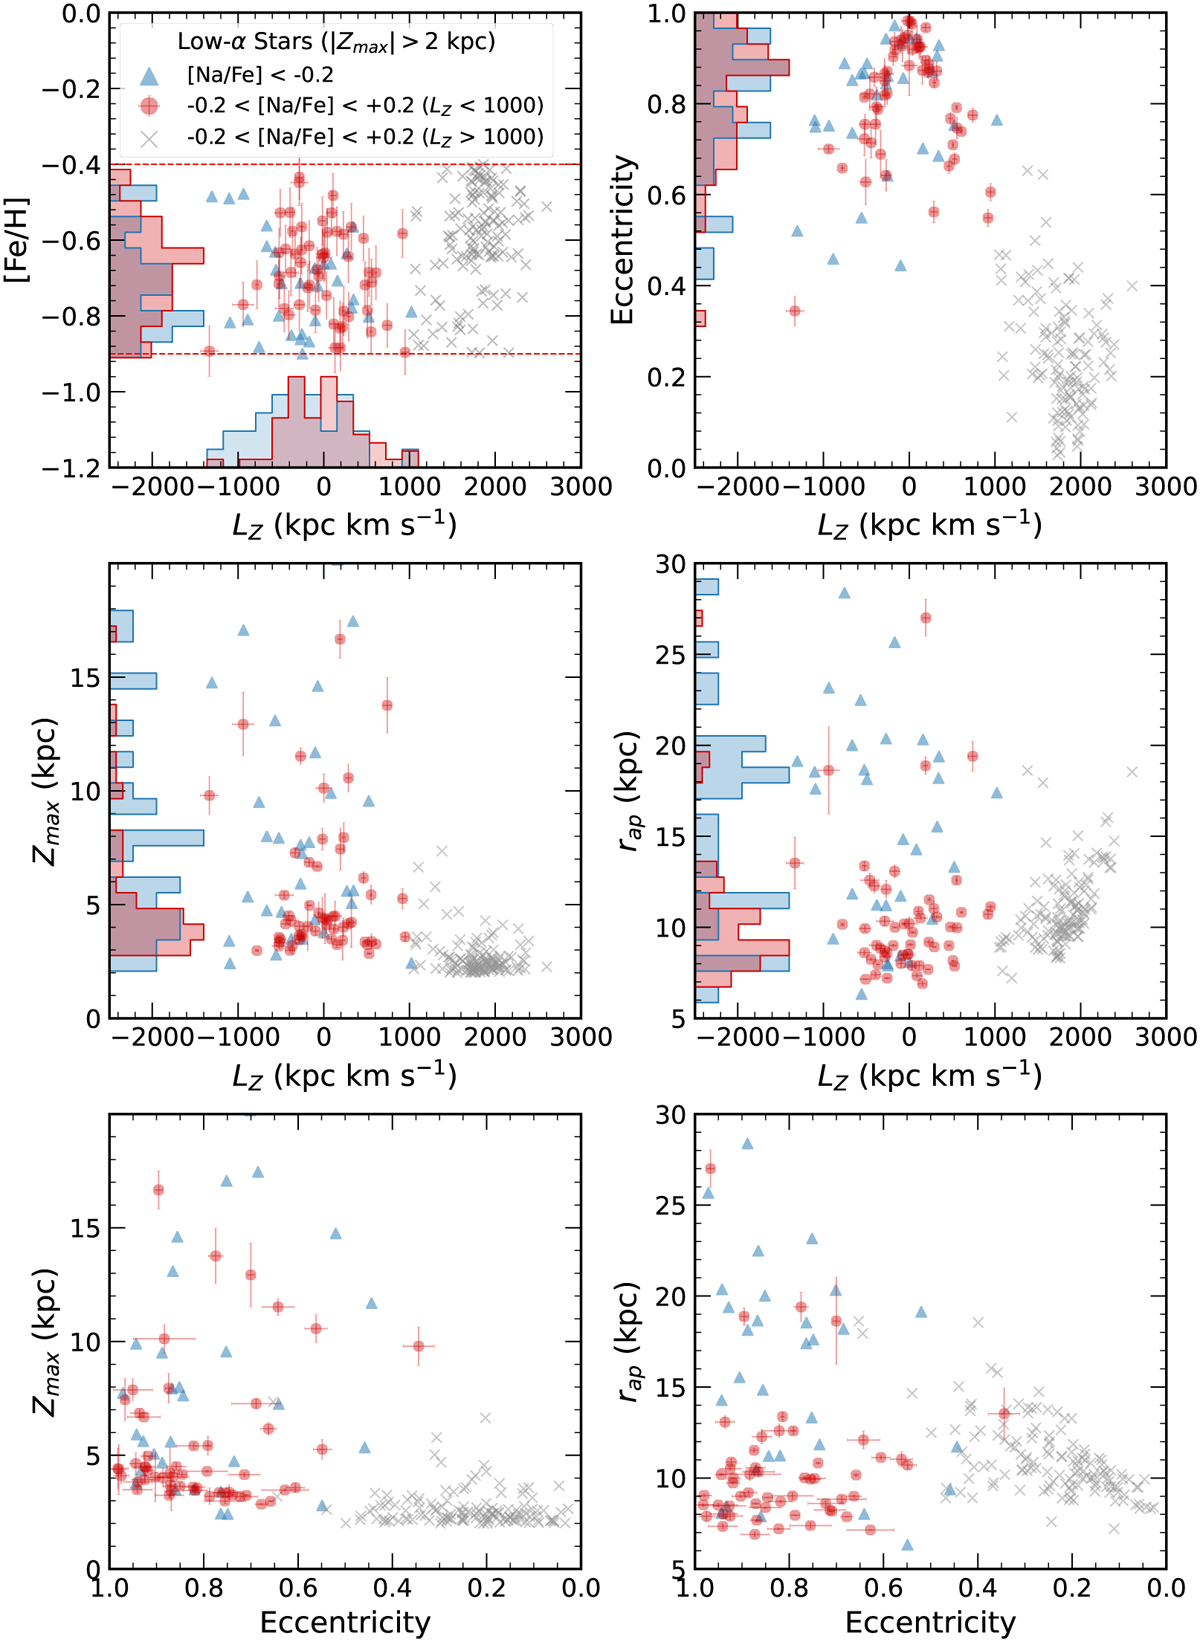
Spatial and orbital properties of low-α stars with −0.9 < [Fe/H] < −0.4 in the GALAH sample. The stars were divided into two groups based on their [Na/Fe] abundances (see the middle left panel of Fig. 4): the LAHN stars are displayed as red circles, while other low-α stars with lower [Na/Fe], likely associated with the accreted GSE debris, are indicated by blue triangles. Error bars are shown only for the LAHN group. Histograms display the distributions of each group using the same colour scheme. In addition to these two groups, high-LZ(> 1000 kpc km s−1.; disc-like) stars that meet the same abundance criteria as the LAHN population are marked with grey crosses. Corresponding plots for high-α stars are provided in Appendix B.
Current usage metrics show cumulative count of Article Views (full-text article views including HTML views, PDF and ePub downloads, according to the available data) and Abstracts Views on Vision4Press platform.
Data correspond to usage on the plateform after 2015. The current usage metrics is available 48-96 hours after online publication and is updated daily on week days.
Initial download of the metrics may take a while.