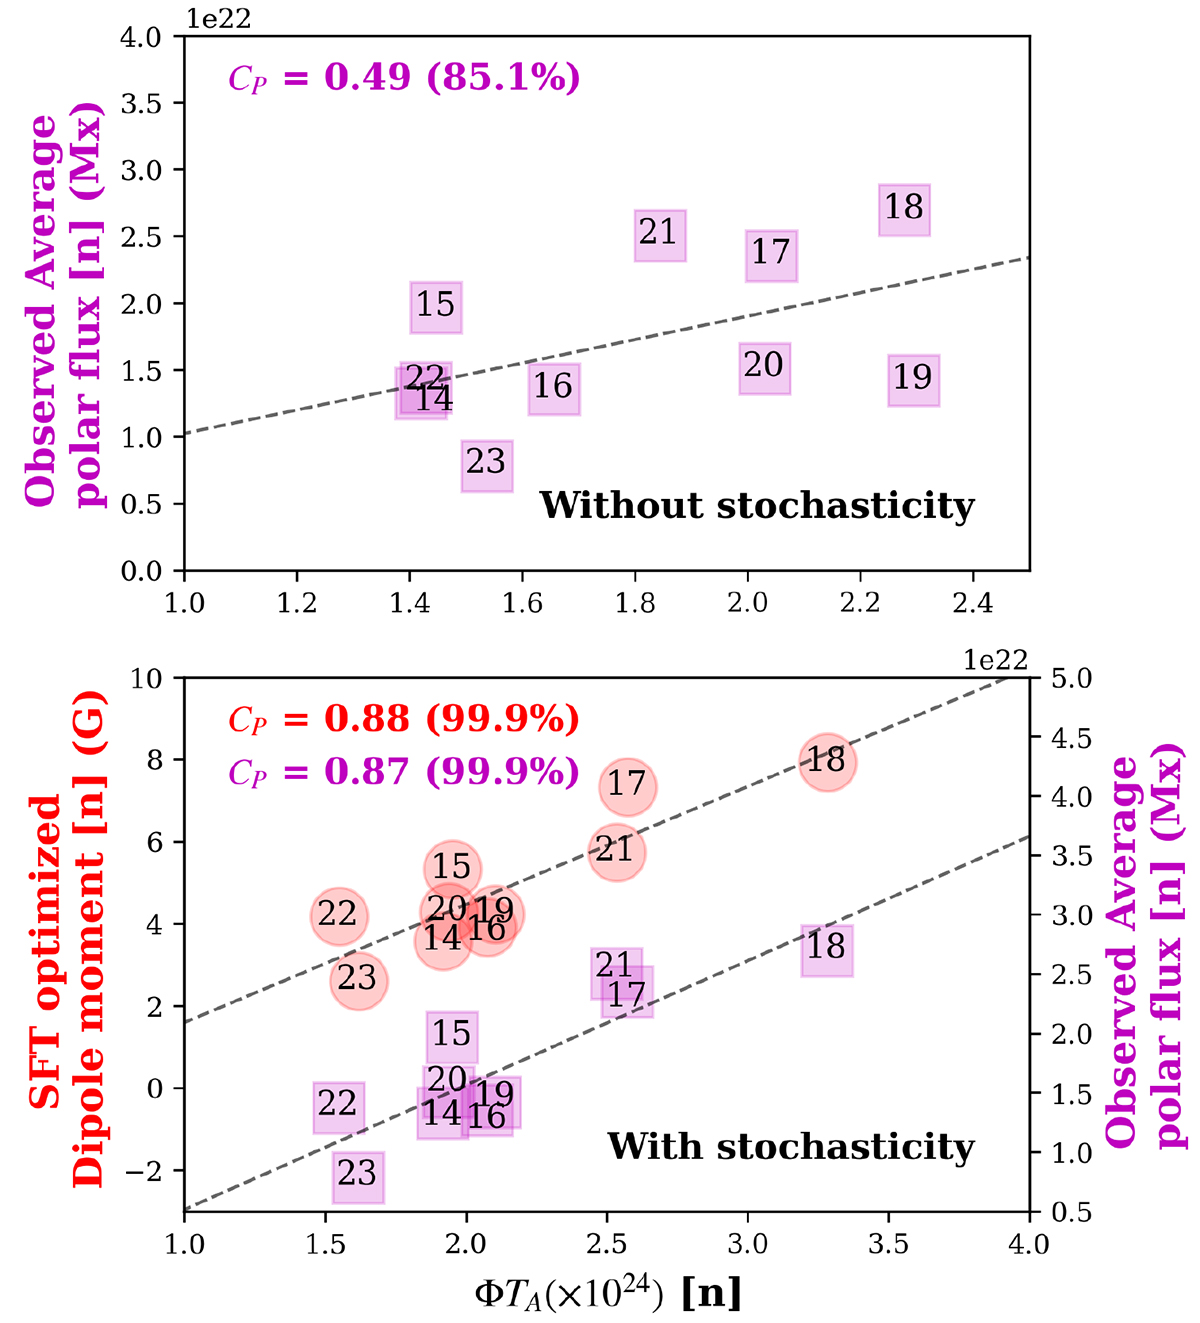
Fig. 3.
Download original image
Statistical correlation analysis. Top panel: Correlation between the flux-weighted tilt coefficient multiplied by total flux (Φ>TA) for the nth solar cycle and the observed average polar flux at the end of the same cycle. This correlation is estimated using the sunspot database without incorporating stochasticity. Bottom panel: Correlation between the Φ>TA and two quantities at the end of the same solar cycle (n): (i) the dipole moment simulated by SPhoTraM simulation (left x-axis, red circles), and (ii) the observed average polar flux (right x-axis, magenta squares). These correlations are estimated after incorporating stochasticity in the sunspot emergence statistics. The gray dashed lines in both panels represent the best-fit linear regressions.
Current usage metrics show cumulative count of Article Views (full-text article views including HTML views, PDF and ePub downloads, according to the available data) and Abstracts Views on Vision4Press platform.
Data correspond to usage on the plateform after 2015. The current usage metrics is available 48-96 hours after online publication and is updated daily on week days.
Initial download of the metrics may take a while.