Fig. A.2.
Download original image
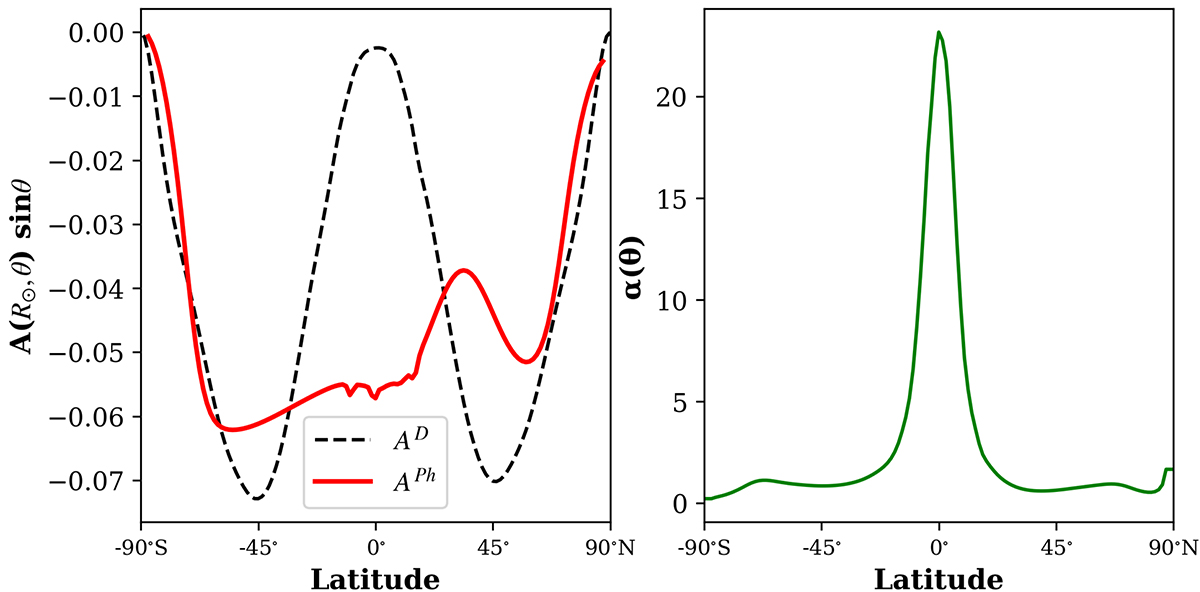
Vector potential from solar dynamo model and SPhoTraM and the correction function. Left panel: Surface vector potential at the minima of solar cycle 16 (beginning of cycle 17) from SPhoTraM simulation (APh denoted by red curve) and from dynamo run (AD denoted by black dashed line). Right panel: Latitudinal correction function α(θ).
Current usage metrics show cumulative count of Article Views (full-text article views including HTML views, PDF and ePub downloads, according to the available data) and Abstracts Views on Vision4Press platform.
Data correspond to usage on the plateform after 2015. The current usage metrics is available 48-96 hours after online publication and is updated daily on week days.
Initial download of the metrics may take a while.