Fig. 14.
Download original image
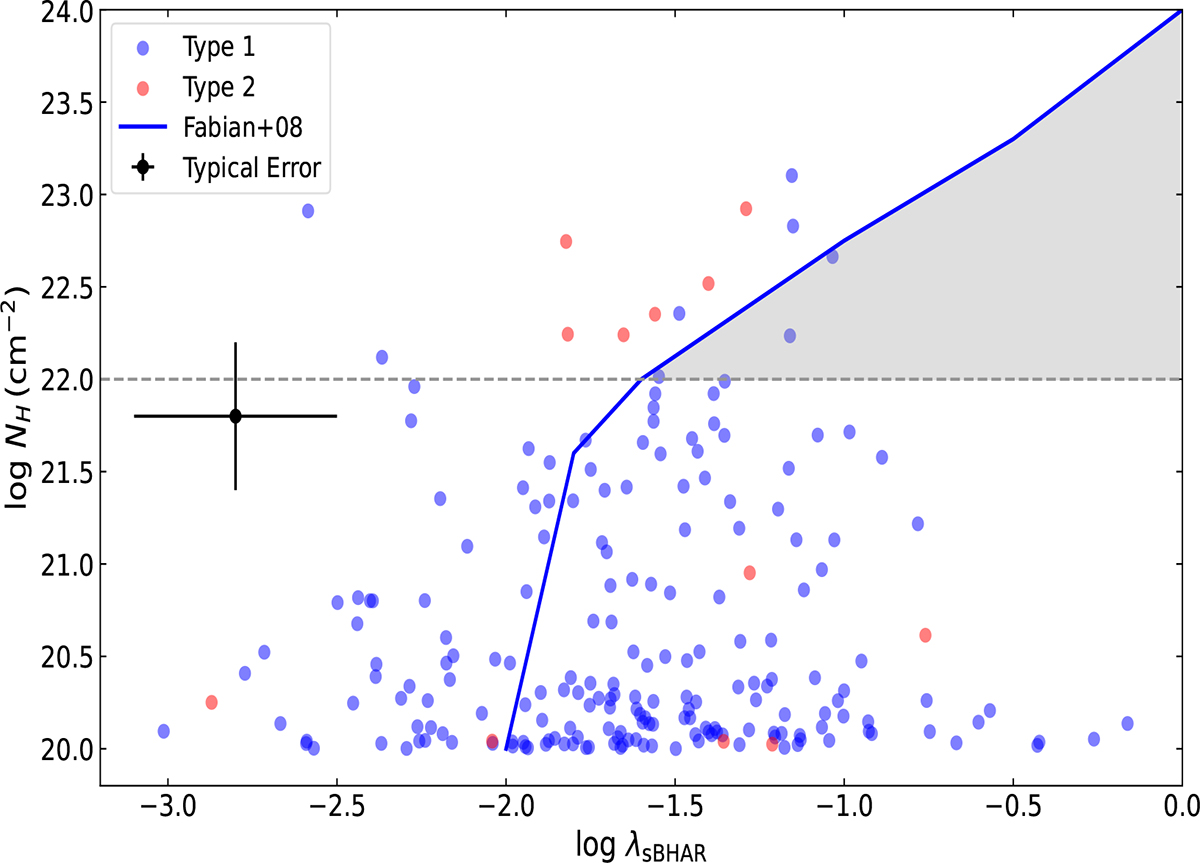
Distribution of the type 1 and 2 AGNs in the NH − λsBHAR space. The horizontal dashed line at log NH = 22 cm−2 marks the region where dust lanes from the host galaxy are typically expected to contribute to the line-of-sight column density. The blue curve represents the effective Eddington ratio, assuming a dust abundance of 0.3 times the galactic value (Fabian et al. 2008). The blowout phase, i.e. the region in the NH − λsBHAR space where radiation pressure pushes away the obscuring material, is shown by the shaded area. Typical uncertainties are ∼0.4 dex in NH and ∼0.3 dex in λsBHAR (on logarithmic scale in both cases). These should be taken into account when interpreting whether individual points fall above or below the threshold.
Current usage metrics show cumulative count of Article Views (full-text article views including HTML views, PDF and ePub downloads, according to the available data) and Abstracts Views on Vision4Press platform.
Data correspond to usage on the plateform after 2015. The current usage metrics is available 48-96 hours after online publication and is updated daily on week days.
Initial download of the metrics may take a while.