Fig. 8
Download original image
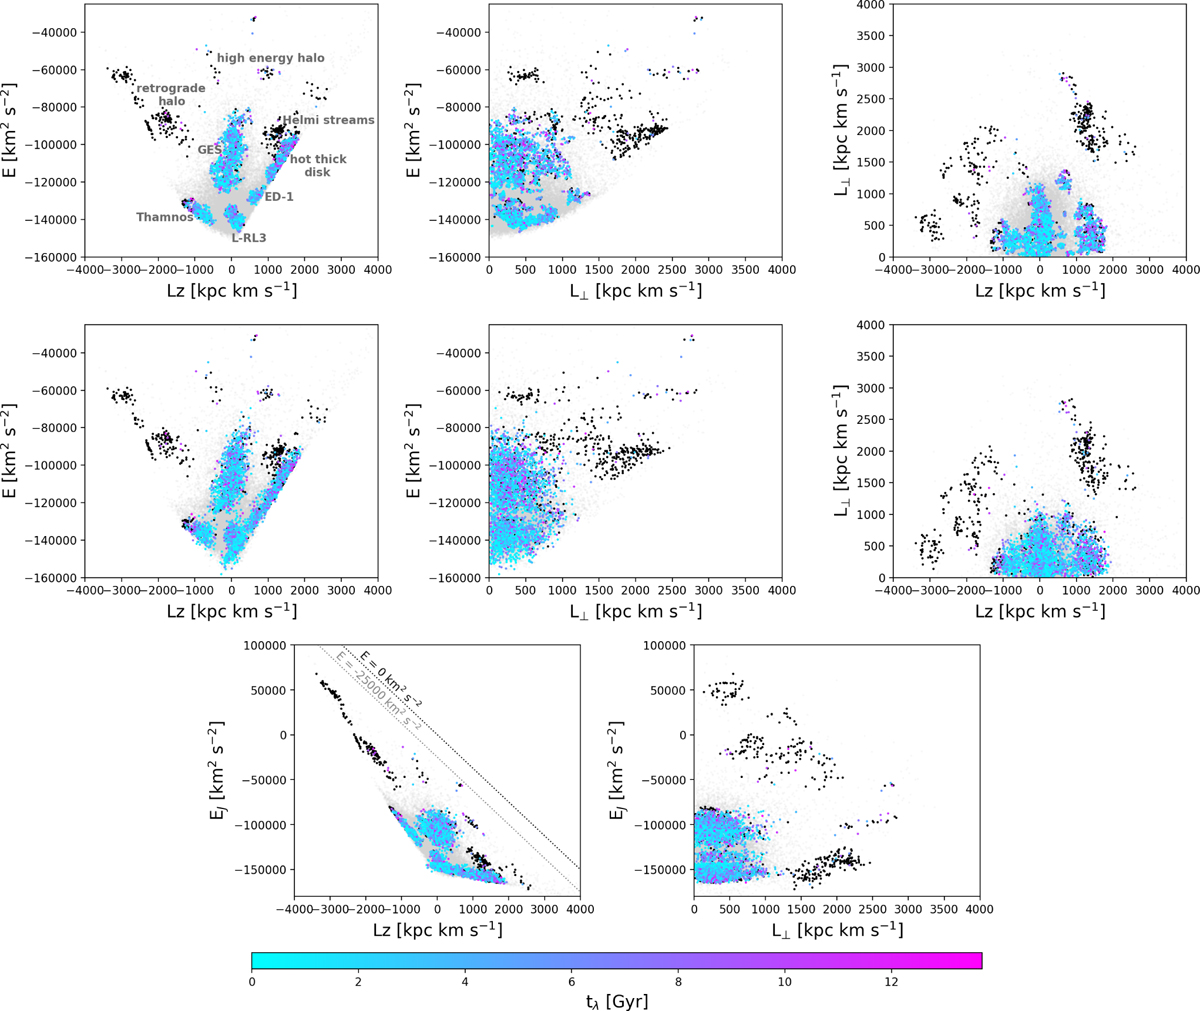
Top panel: stars part of the substructures identified by Dodd et al. (2023) in (E, Lz, L⊥) space at the present day, colour-coded by tλ. Stars with tλ > 13.7 Gyr are shown in black. The light grey stars in the background correspond to the whole local halo sample. A number of substructures and regions of (E, Lz, L⊥) space are labelled in the leftmost panel. Middle panel: same as the top panel, but after 10 Gyr of integration time in the fiducial potential, and only showing stars whose final three apocentres were on average larger than 7 kpc. Bottom panel: also after 10 Gyr of integration time, but showing (EJ, Lz) and (EJ, L⊥) instead of E. We have indicated the line EJ = E−Ωb Lz for E = −25 000 km2 s−2 (corresponding to the upper limit in energy of the top and middle panel) and E = 0 km2 s−2 (corresponding to unbound stars in our potential).
Current usage metrics show cumulative count of Article Views (full-text article views including HTML views, PDF and ePub downloads, according to the available data) and Abstracts Views on Vision4Press platform.
Data correspond to usage on the plateform after 2015. The current usage metrics is available 48-96 hours after online publication and is updated daily on week days.
Initial download of the metrics may take a while.