Open Access
Fig. 1.
Download original image
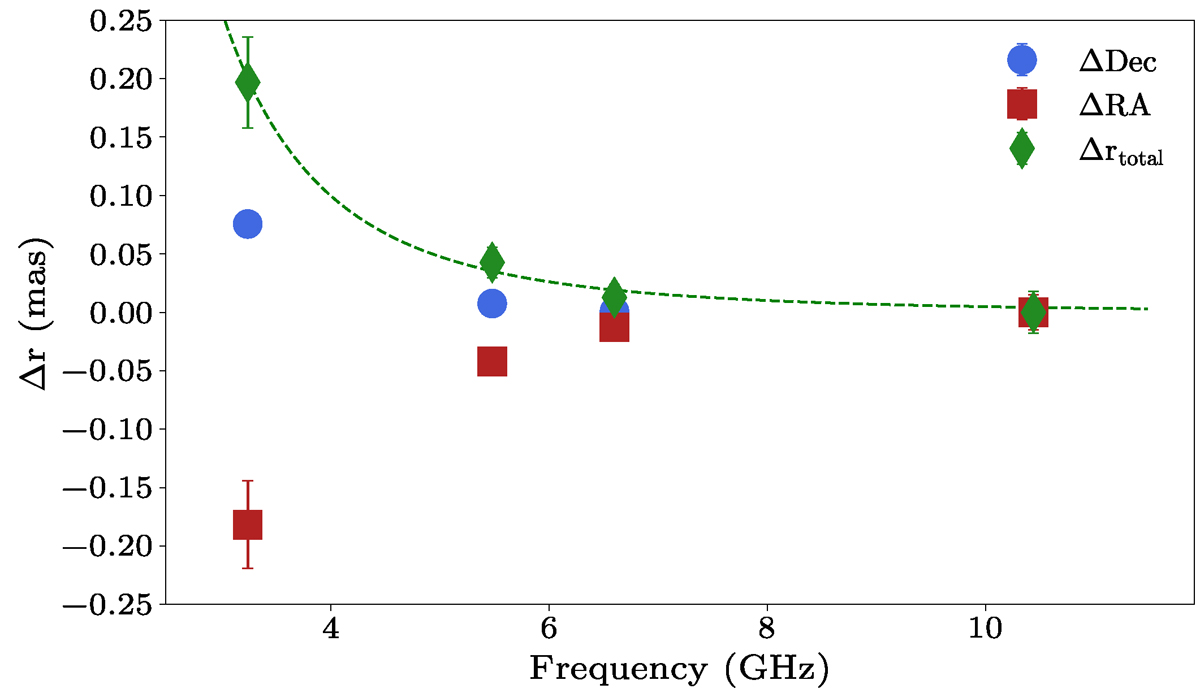
Measured relative core shift as a function of frequency for 1803+784. The total shift vector, along with its components in right ascension and declination, are shown. The error bars represent 3σ uncertainties. The best-fit model is shown as a dashed green line.
Current usage metrics show cumulative count of Article Views (full-text article views including HTML views, PDF and ePub downloads, according to the available data) and Abstracts Views on Vision4Press platform.
Data correspond to usage on the plateform after 2015. The current usage metrics is available 48-96 hours after online publication and is updated daily on week days.
Initial download of the metrics may take a while.