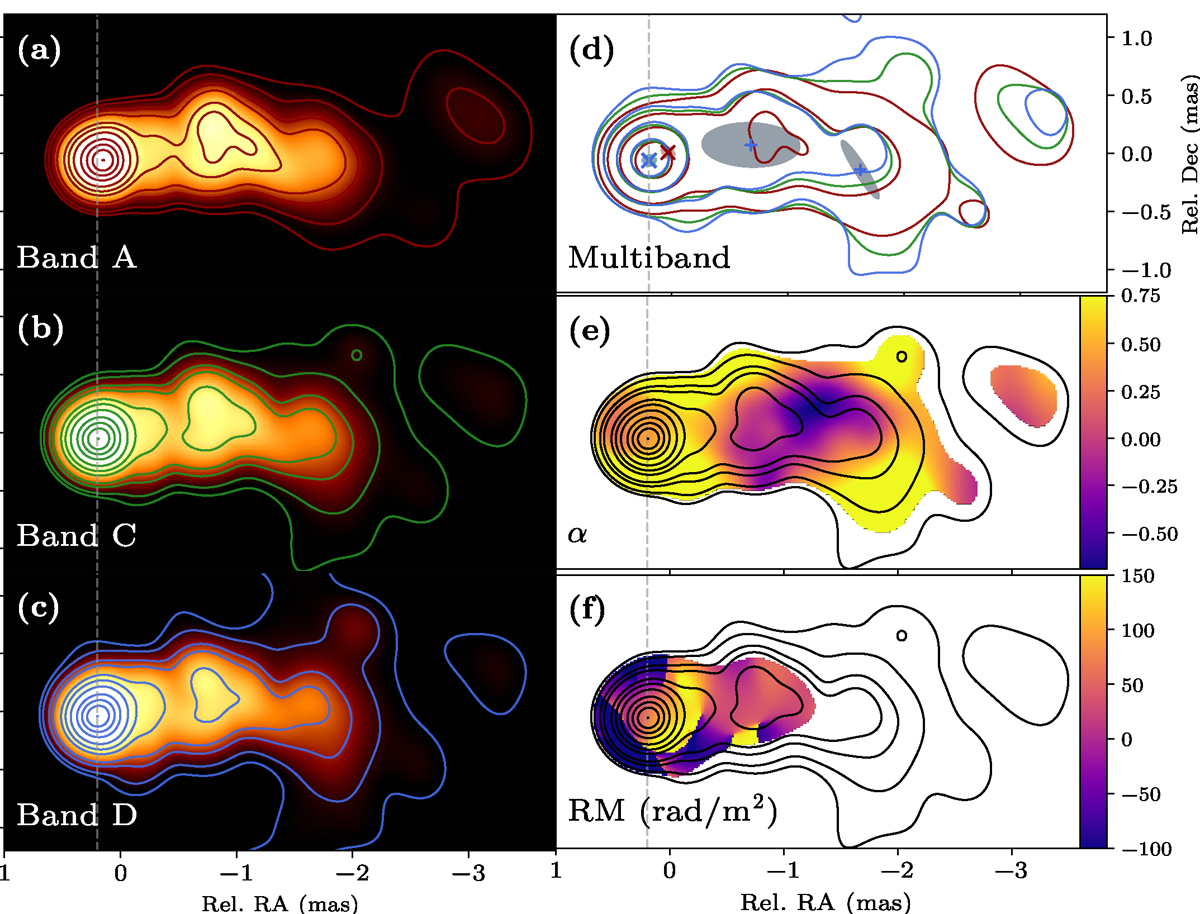
Fig. 3.
Download original image
Multi-frequency polarimetric image of 1803+784. Panels (a)–(c) show the total intensity maps at bands A, C, and D in logarithmic scale, normalized to their peak. The dashed vertical line indicates the core position at band D, marking the core shift. Panel (e) displays all contours from the four bands superposed, along with the core and jet Gaussian models. Panel (f) shows the spectral index map (α). Panel (g) presents the rotation measure (RM) map. Only regions above 0.8% of the peak intensity are included.
Current usage metrics show cumulative count of Article Views (full-text article views including HTML views, PDF and ePub downloads, according to the available data) and Abstracts Views on Vision4Press platform.
Data correspond to usage on the plateform after 2015. The current usage metrics is available 48-96 hours after online publication and is updated daily on week days.
Initial download of the metrics may take a while.