Fig. 1.
Download original image
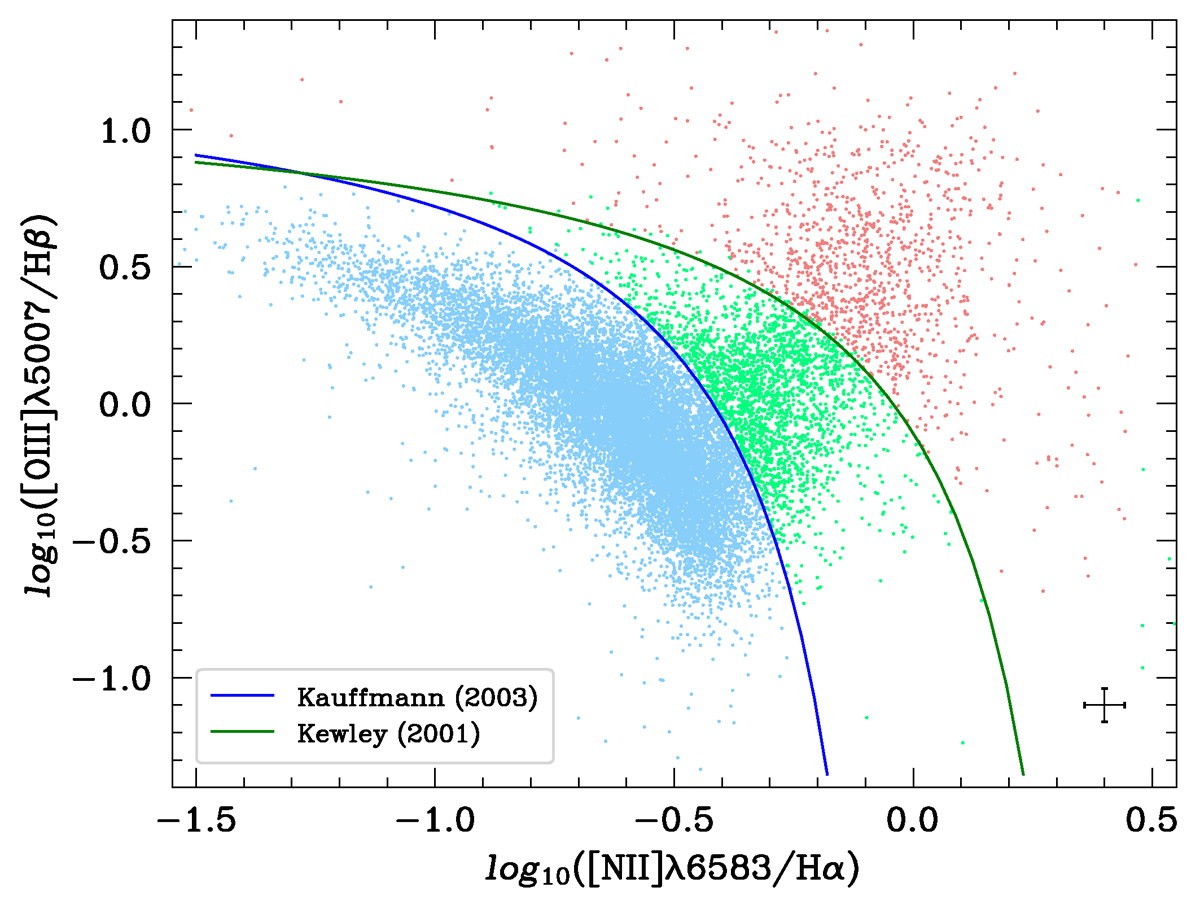
BPT diagram for GAMA galaxies. Galaxies below the Kauffmann et al. (2003) function correspond to SF galaxies (blue points), while the galaxies above the Kewley et al. (2001) function correspond to AGN galaxies (red points). Galaxies that fall between the Kewley et al. (2001) and Kauffmann et al. (2003) functions are classified as composite galaxies (green points). The error cross corresponds to the median errors of the axes calculated using Monte Carlo propagation.
Current usage metrics show cumulative count of Article Views (full-text article views including HTML views, PDF and ePub downloads, according to the available data) and Abstracts Views on Vision4Press platform.
Data correspond to usage on the plateform after 2015. The current usage metrics is available 48-96 hours after online publication and is updated daily on week days.
Initial download of the metrics may take a while.