Fig. 3.
Download original image
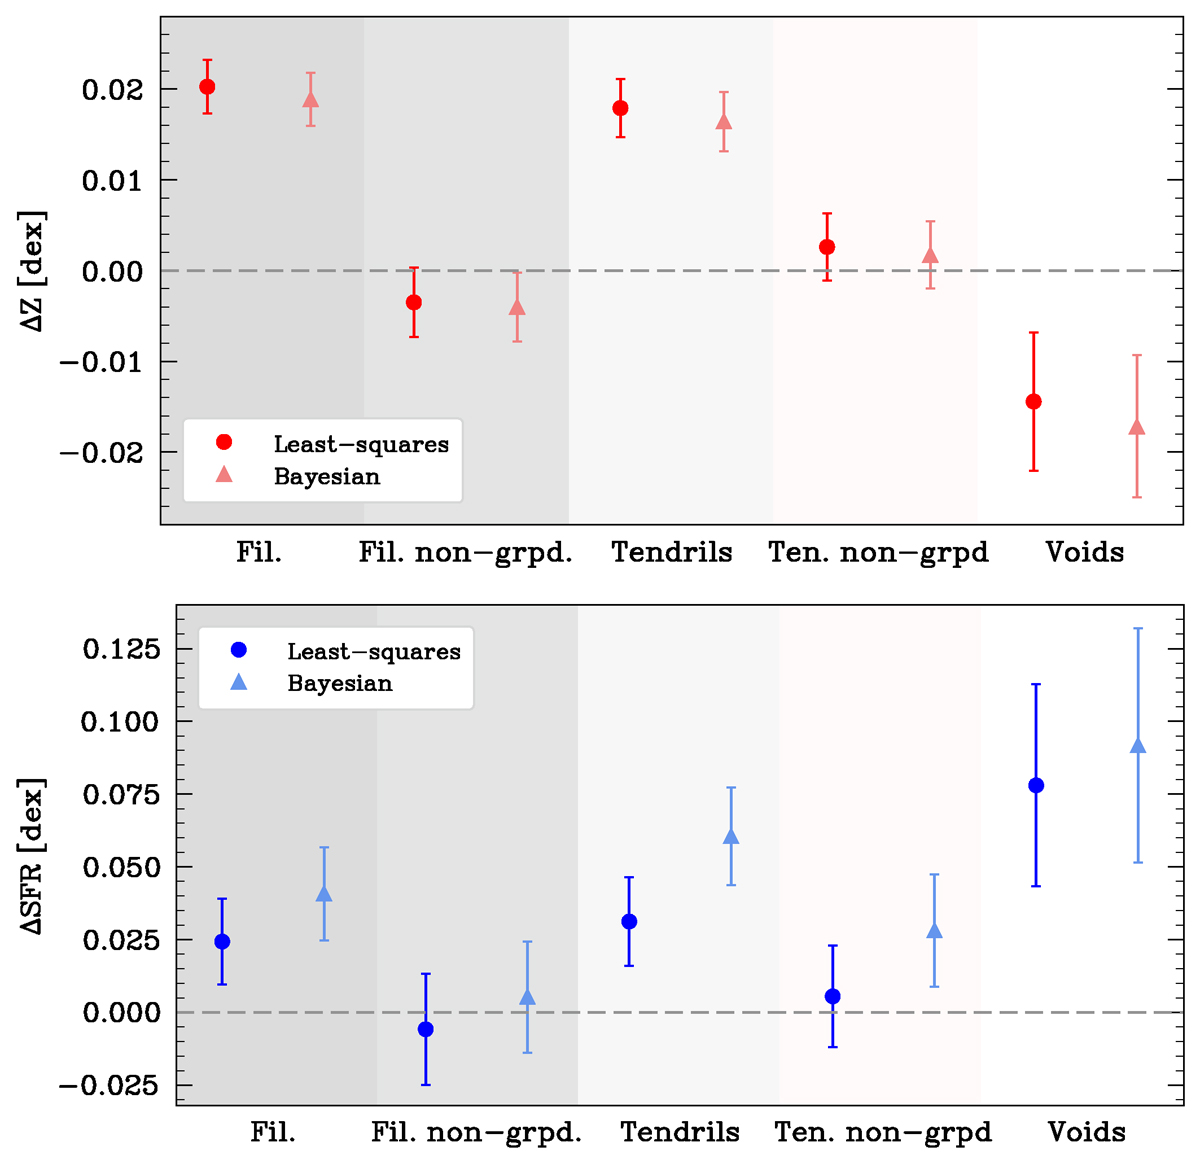
Differences in Z (top) and SFR (bottom) between galaxies in filaments (grouped and non-grouped), tendrils (grouped and non-grouped), and voids and their corresponding control samples, using the least-squares (circle points) and Bayesian (triangle points) methods. The error bars have been calculated using bootstrapping for the least-squares method and 1σ Markov chains for the Bayesian method.
Current usage metrics show cumulative count of Article Views (full-text article views including HTML views, PDF and ePub downloads, according to the available data) and Abstracts Views on Vision4Press platform.
Data correspond to usage on the plateform after 2015. The current usage metrics is available 48-96 hours after online publication and is updated daily on week days.
Initial download of the metrics may take a while.