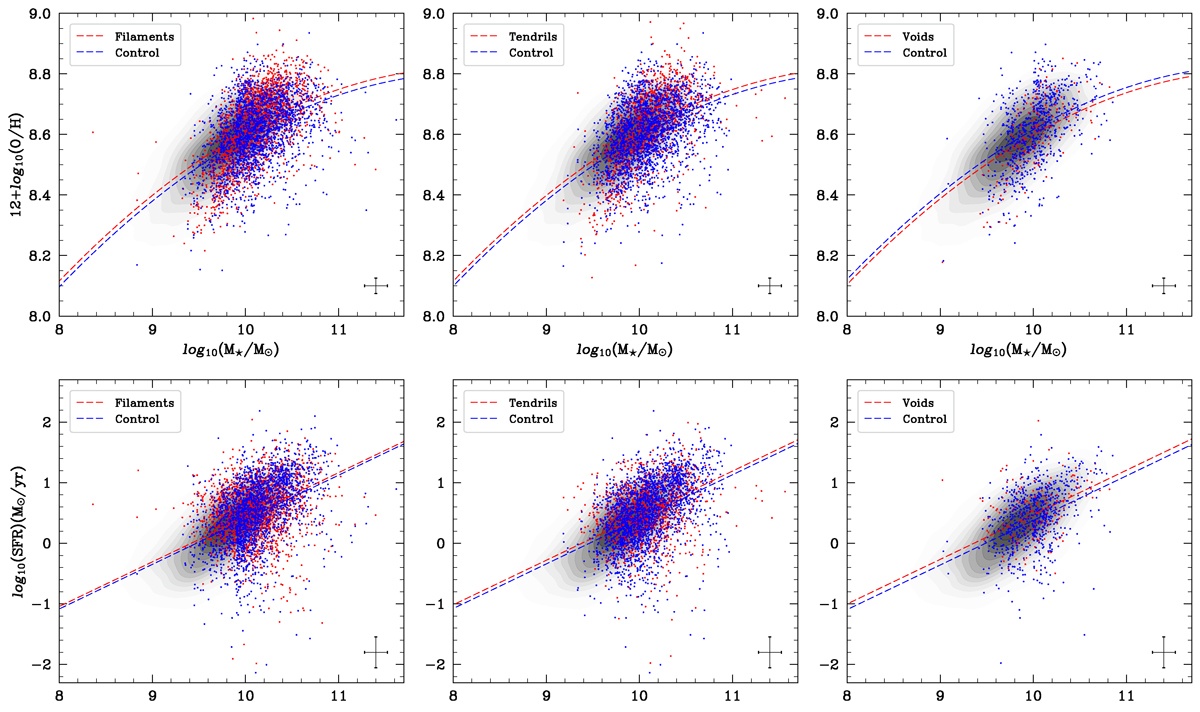
Fig. 5.
Download original image
M⋆–Z (top) and M⋆–SFR (bottom) relations, using the Pettini & Pagel (2004) and Hopkins et al. (2003) calibrations respectively. The galaxies in filaments (left), tendrils galaxies (centre), and voids (right) are marked as red points alongside their corresponding control samples in blue. All SF galaxies are represented in the background as a black density scatter plot. The dashed lines represent the linear regressions calculated by the Bayesian method for each galaxy type (in red) and its corresponding control sample (in blue). Error bars are the median errors of the axes calculated using Monte Carlo propagation.
Current usage metrics show cumulative count of Article Views (full-text article views including HTML views, PDF and ePub downloads, according to the available data) and Abstracts Views on Vision4Press platform.
Data correspond to usage on the plateform after 2015. The current usage metrics is available 48-96 hours after online publication and is updated daily on week days.
Initial download of the metrics may take a while.