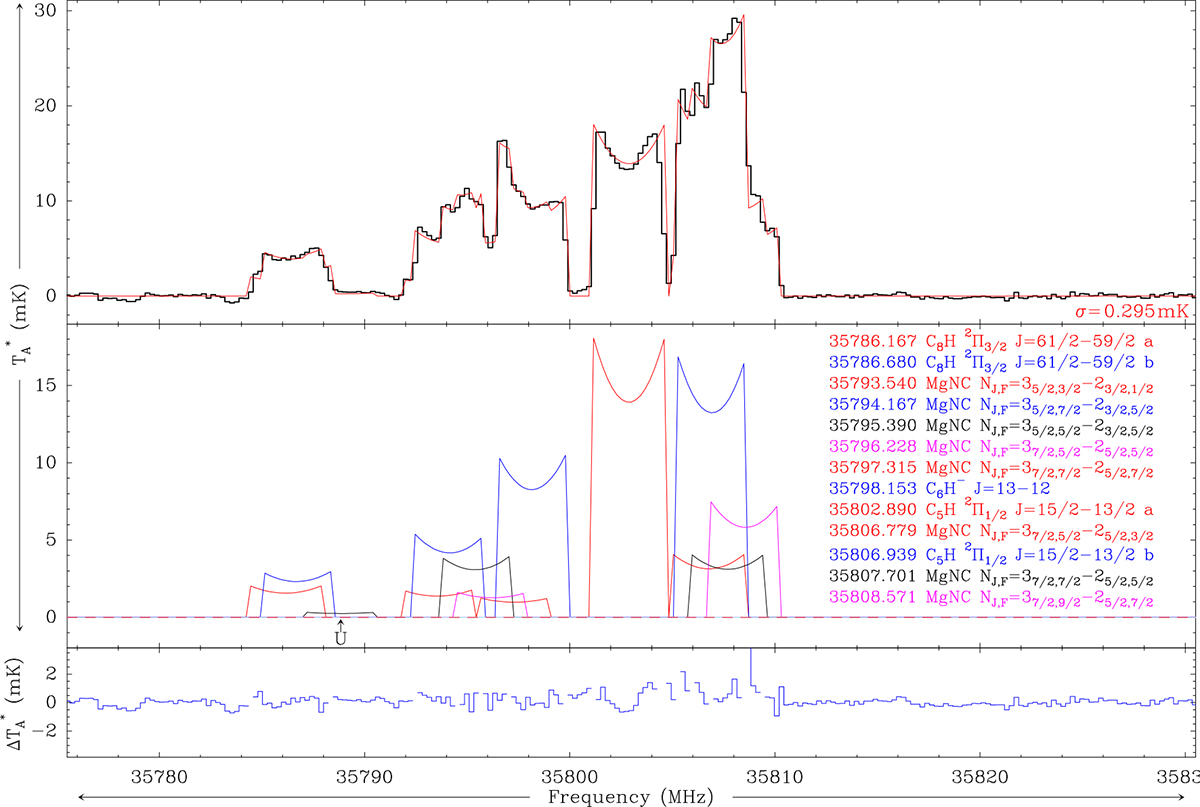
Fig. 1.
Download original image
Extreme example of global fit of IRC+10216 Q-band data to a series of individual lines (for H = 0.3) with integrated areas that can be obtained in a quite confident way, described in Section 3, despite the blending. The residuals from the global fit are plotted in the bottom panel. All spectral features present in the data, except a very small one, can be identified at present.
Current usage metrics show cumulative count of Article Views (full-text article views including HTML views, PDF and ePub downloads, according to the available data) and Abstracts Views on Vision4Press platform.
Data correspond to usage on the plateform after 2015. The current usage metrics is available 48-96 hours after online publication and is updated daily on week days.
Initial download of the metrics may take a while.