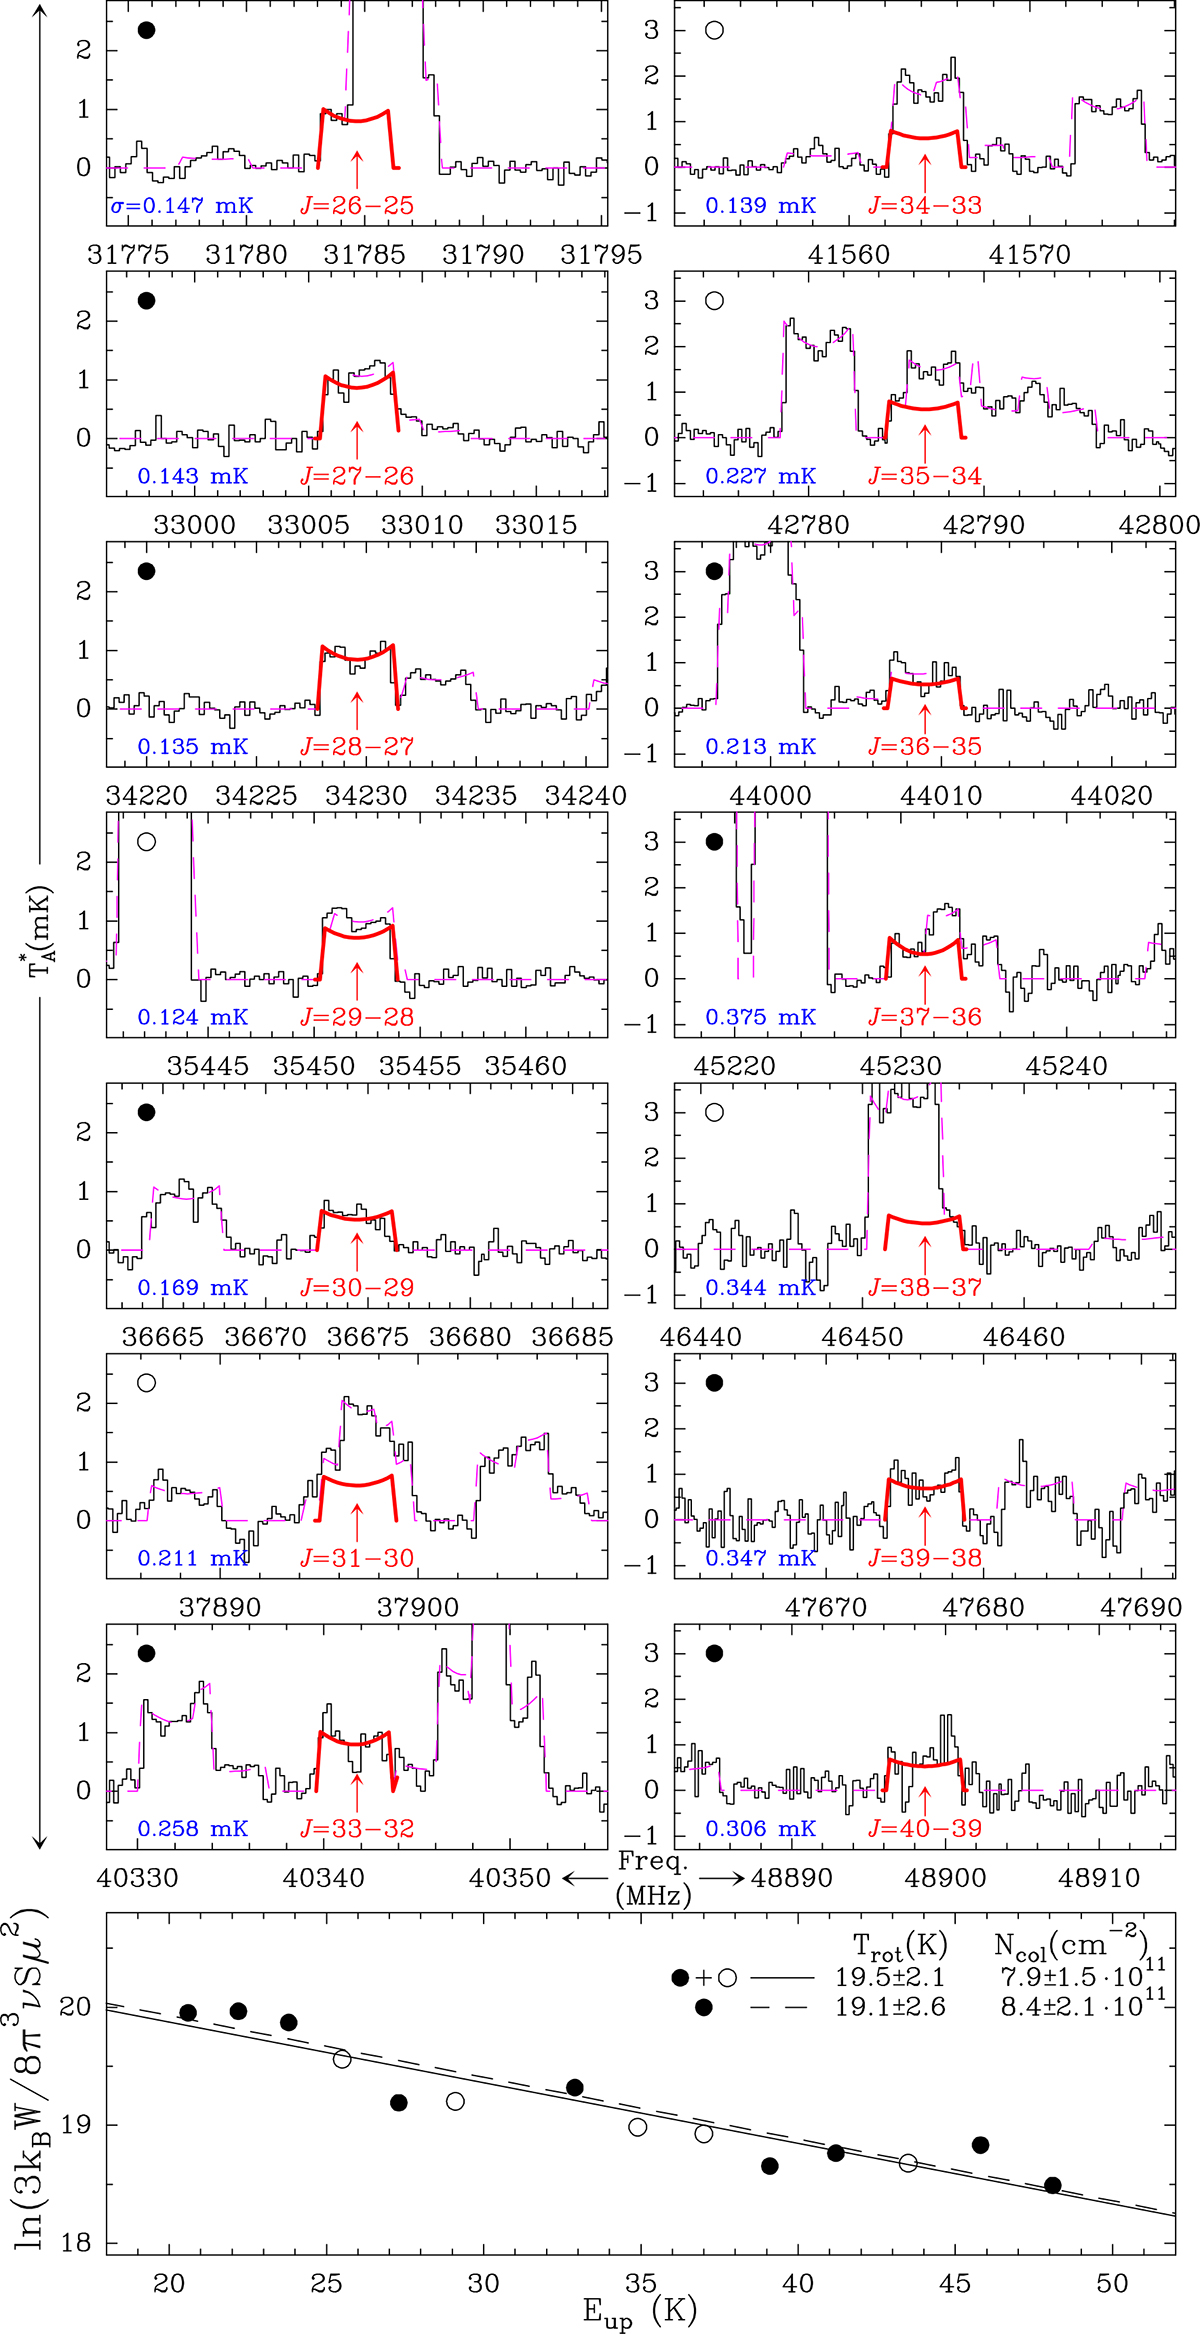
Fig. 2.
Download original image
SiC6 lines observed in this work, with the fit for them in red. Black dots correspond to lines with no critical blending from other species while open dots identify lines heavily blended. The dashed magenta curves represent the overall fit for all lines according to the parameters given in Table 1. The bold red curves correspond to the contribution of the SiC6 lines alone. The rms or σ values given for each spectrum in dark blue are calculated from the channels, with no signal in the fitted spectrum. The best-fit rotational diagrams using only the not heavily blended SiC6 rotational transitions are shown separately as solid and dashed lines, respectively, in the bottom panel.
Current usage metrics show cumulative count of Article Views (full-text article views including HTML views, PDF and ePub downloads, according to the available data) and Abstracts Views on Vision4Press platform.
Data correspond to usage on the plateform after 2015. The current usage metrics is available 48-96 hours after online publication and is updated daily on week days.
Initial download of the metrics may take a while.