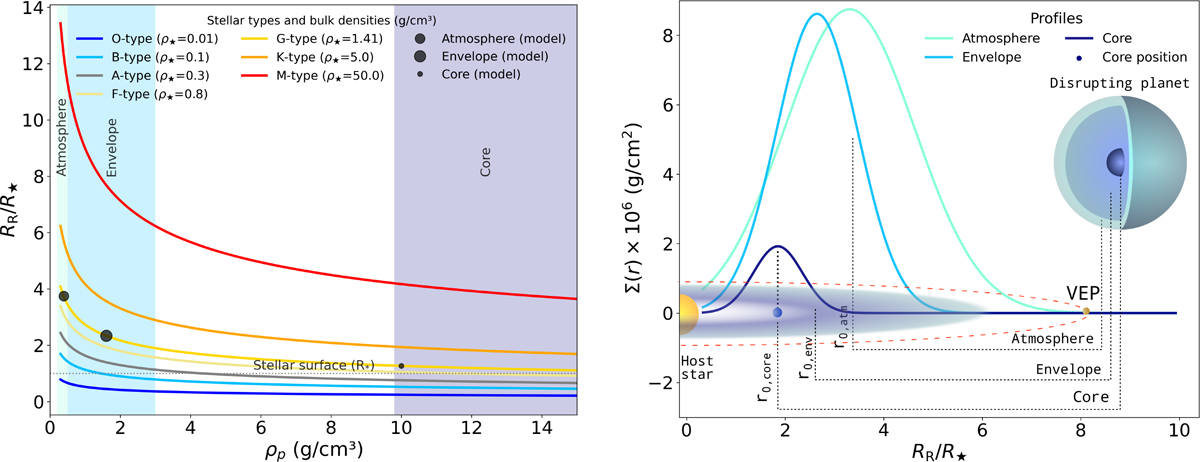
Fig. 1.
Download original image
(a) Roche limit, RR, normalized by the stellar radius, R⋆ (see Appendix A), R★, as a function of planetary bulk density, ρp, for main-sequence stars of different spectral types (O–M). The coloured bands represent the density ranges of a three-layer Jupiter-like planet model, with black circles marking the Roche limit for each layer used in this work. (b) Surface density profiles, Σ(r), of the disrupted atmosphere (green), envelope (cyan), and core (dark blue), scaled to R★; the core’s location in the simulations is highlighted in dark blue.
Current usage metrics show cumulative count of Article Views (full-text article views including HTML views, PDF and ePub downloads, according to the available data) and Abstracts Views on Vision4Press platform.
Data correspond to usage on the plateform after 2015. The current usage metrics is available 48-96 hours after online publication and is updated daily on week days.
Initial download of the metrics may take a while.