Fig. 2.
Download original image
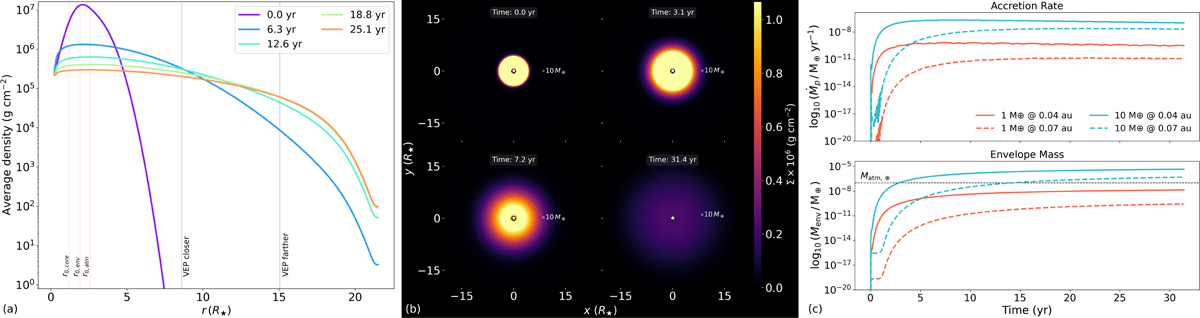
Time evolution of the gas disc and planetary envelopes after the tidal disruption of a Jupiter-like planet. (a) Azimuthally averaged surface density at four times; dashed lines mark the closer and farther VEPs. (b) Disc surface density evolution for the 10 M⊕ case; circles indicate the closer VEP. (c): Accretion rates (top) and envelope masses (bottom) for VEPs at both orbits. Matm, ⊕ indicates the atmospheric mass of Earth.
Current usage metrics show cumulative count of Article Views (full-text article views including HTML views, PDF and ePub downloads, according to the available data) and Abstracts Views on Vision4Press platform.
Data correspond to usage on the plateform after 2015. The current usage metrics is available 48-96 hours after online publication and is updated daily on week days.
Initial download of the metrics may take a while.