Fig. 2.
Download original image
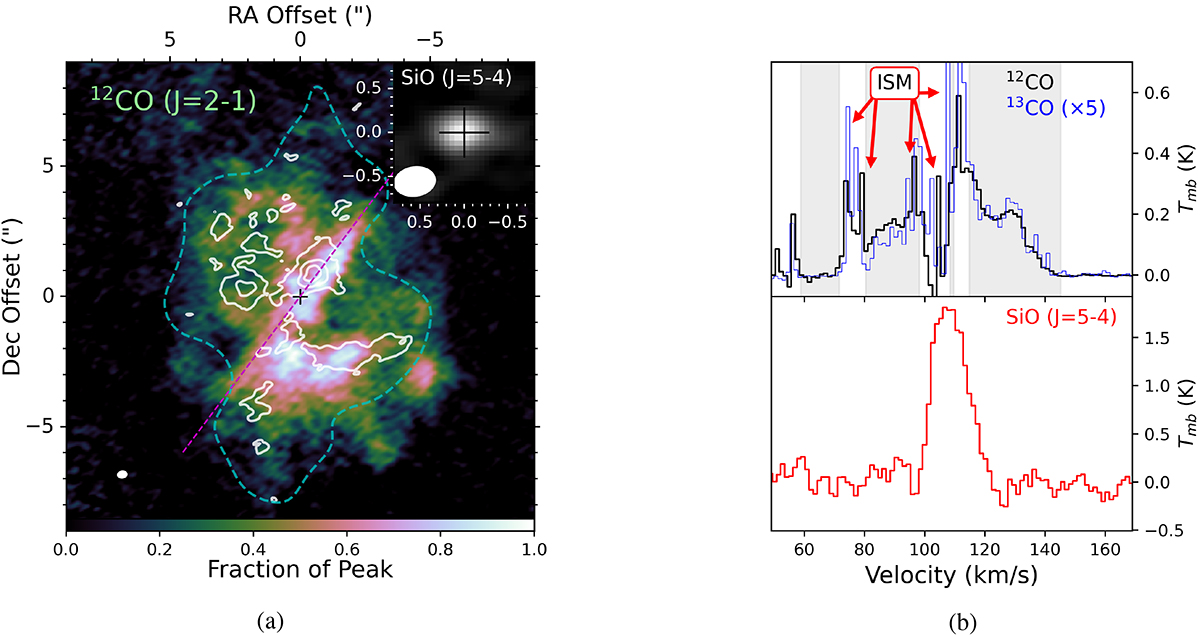
Summary of molecular line emission observed toward DFK52. In the integrated CO map, the white contours denote the 220 GHz continuum emission at [5, 10, 15]σ, the blue dashed contours represent 3σ for the smoothed extended continuum component, the black cross marks the stellar position (as measured by the SiO emission peak), and the ALMA beam is displayed as a white filled ellipse in the lower right corner. The dashed magenta line in the integrated intensity map represents a line cut with PA = 143°. Spectra were extracted taking the central pixel at the stellar position, with CO isotopologue maps first smoothed to a 15″ beam and SiO maps at the native resolution. The grey shaded regions in the CO spectrum indicate the ISM-free channels that were used to produce the moment-zero 12CO image. (a) CO J = 2 − 1 and SiO J = 5 − 4 (inset) moment-zero maps. (b) CO isotopologue (top) and SiO (bottom) spectra.
Current usage metrics show cumulative count of Article Views (full-text article views including HTML views, PDF and ePub downloads, according to the available data) and Abstracts Views on Vision4Press platform.
Data correspond to usage on the plateform after 2015. The current usage metrics is available 48-96 hours after online publication and is updated daily on week days.
Initial download of the metrics may take a while.