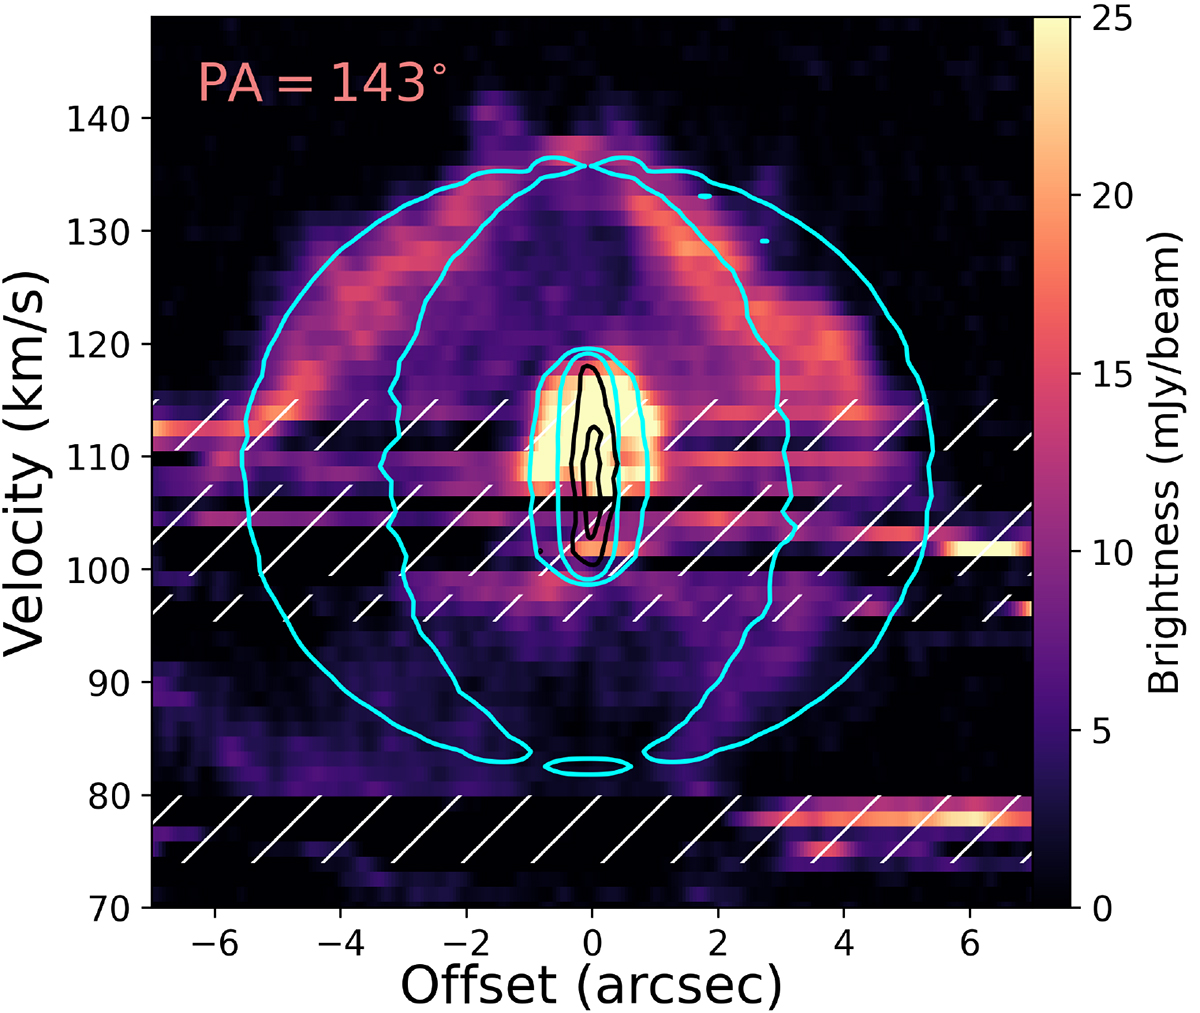
Fig. 3.
Download original image
PV diagram of 12CO (J = 2 − 1) emission for a cut at PA = 143° with a 1″ width. The black contours show SiO (J = 5 − 4) at 3σ and 10σ. The blue contours are simulated 12CO (J = 2 − 1) emission from our two-component RT model, shown at 5 and 15 mJy/beam. The hatched regions denote velocity ranges heavily affected by ISM contamination.
Current usage metrics show cumulative count of Article Views (full-text article views including HTML views, PDF and ePub downloads, according to the available data) and Abstracts Views on Vision4Press platform.
Data correspond to usage on the plateform after 2015. The current usage metrics is available 48-96 hours after online publication and is updated daily on week days.
Initial download of the metrics may take a while.