Fig. 11
Download original image
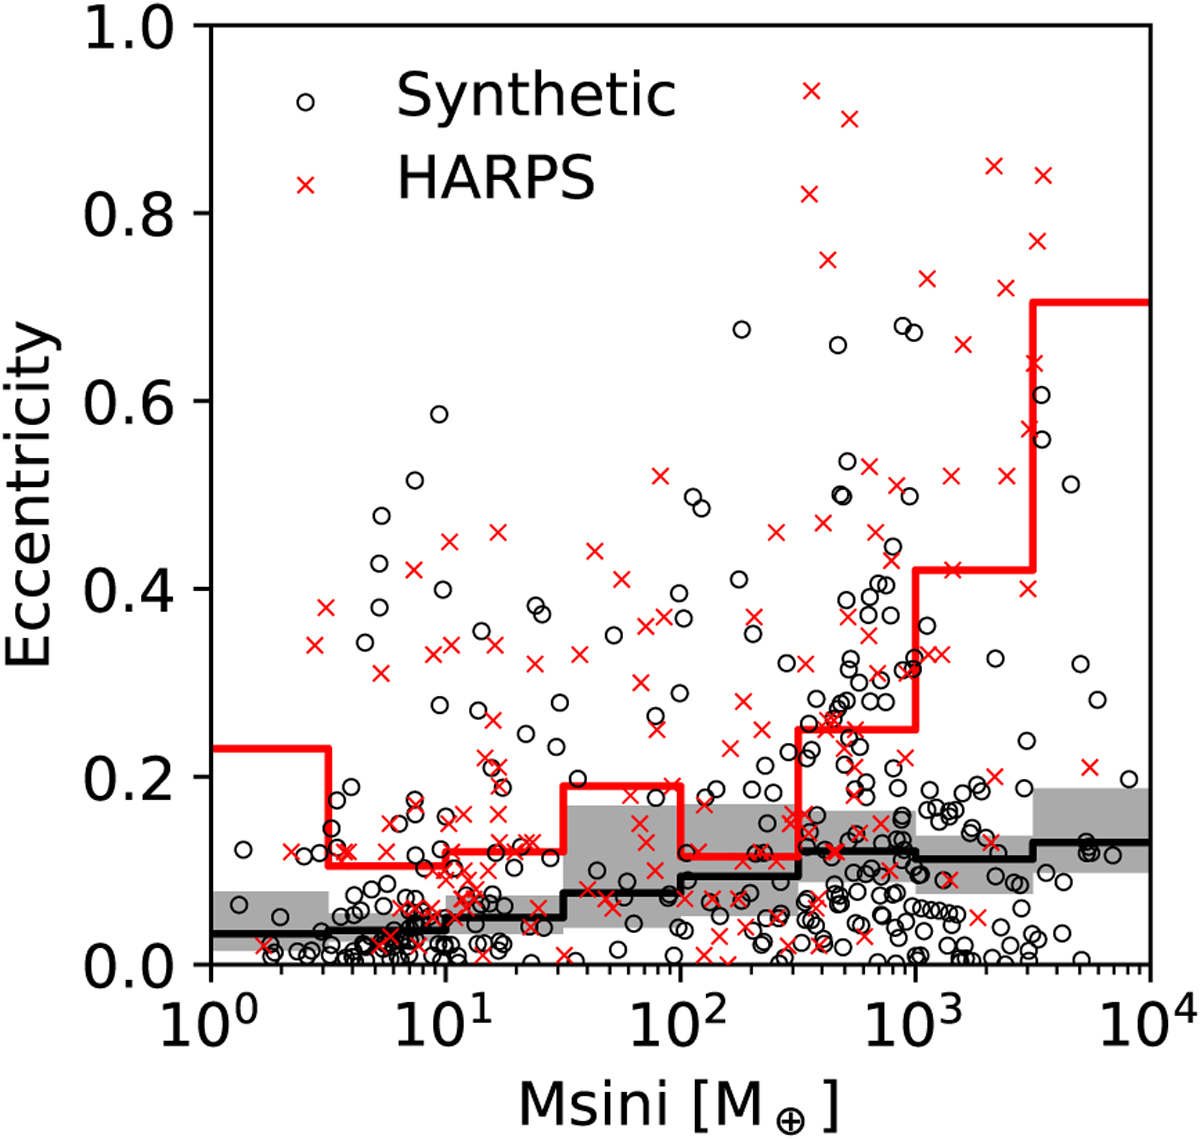
Eccentricity as a function of planet mass (M sin i) for the biased 100-embryo population (NG76, in black) and the HARPS/Coralie surveys (M11, in red). The scatter plot shows one random observation of the synthetic population against the HARPS/Coralie planets. The lines show the medians in the respective range, but one should note the low number of planets in the bins on the right. For the synthetic planets, the values are obtained over 1000 simulated observations of the underlying population and showing the 95% confidence interval.
Current usage metrics show cumulative count of Article Views (full-text article views including HTML views, PDF and ePub downloads, according to the available data) and Abstracts Views on Vision4Press platform.
Data correspond to usage on the plateform after 2015. The current usage metrics is available 48-96 hours after online publication and is updated daily on week days.
Initial download of the metrics may take a while.