Fig. B.1
Download original image
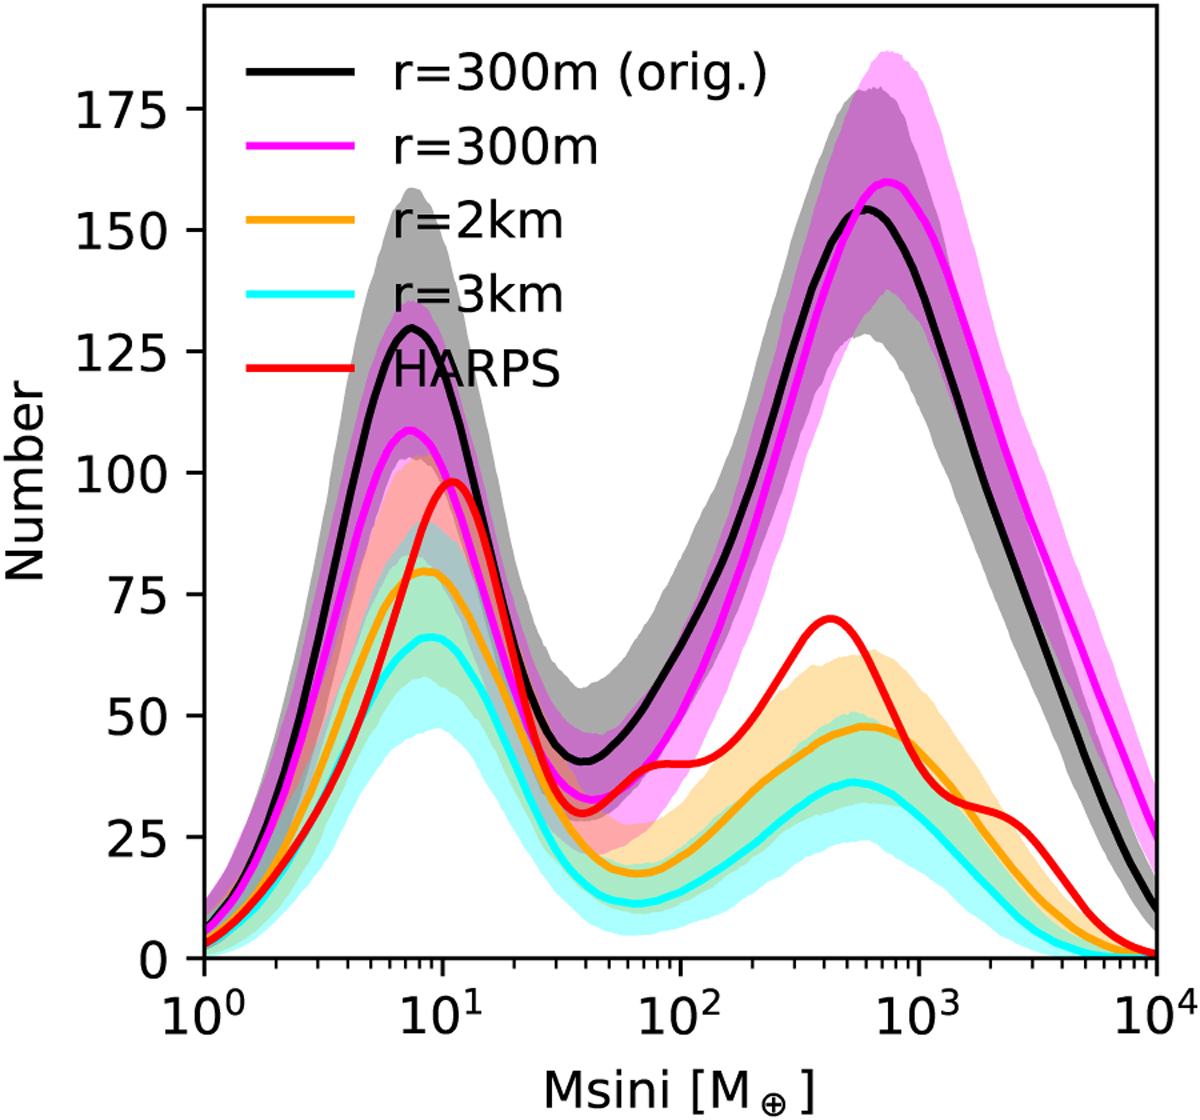
Comparison of the planet mass distribution between different biased synthetic populations and the observed population. The nominal population with 20 embryos per system (NG75, same as the orange line in Fig. A.1) is shown with the black line; the others use the minimum of the Bondi rate and radial flow of the gas disc for the disc-limited gas accretion rate with different planetesimal size, as given in the legend. For each of the synthetic populations, we performed 1000 Monte Carlo synthetic observations. The bold line showing the median of these, and the lighter region shows the 95% confidence interval. The results are shown as a kernel density estimate, though rescaled to be absolute.
Current usage metrics show cumulative count of Article Views (full-text article views including HTML views, PDF and ePub downloads, according to the available data) and Abstracts Views on Vision4Press platform.
Data correspond to usage on the plateform after 2015. The current usage metrics is available 48-96 hours after online publication and is updated daily on week days.
Initial download of the metrics may take a while.