Fig. 2
Download original image
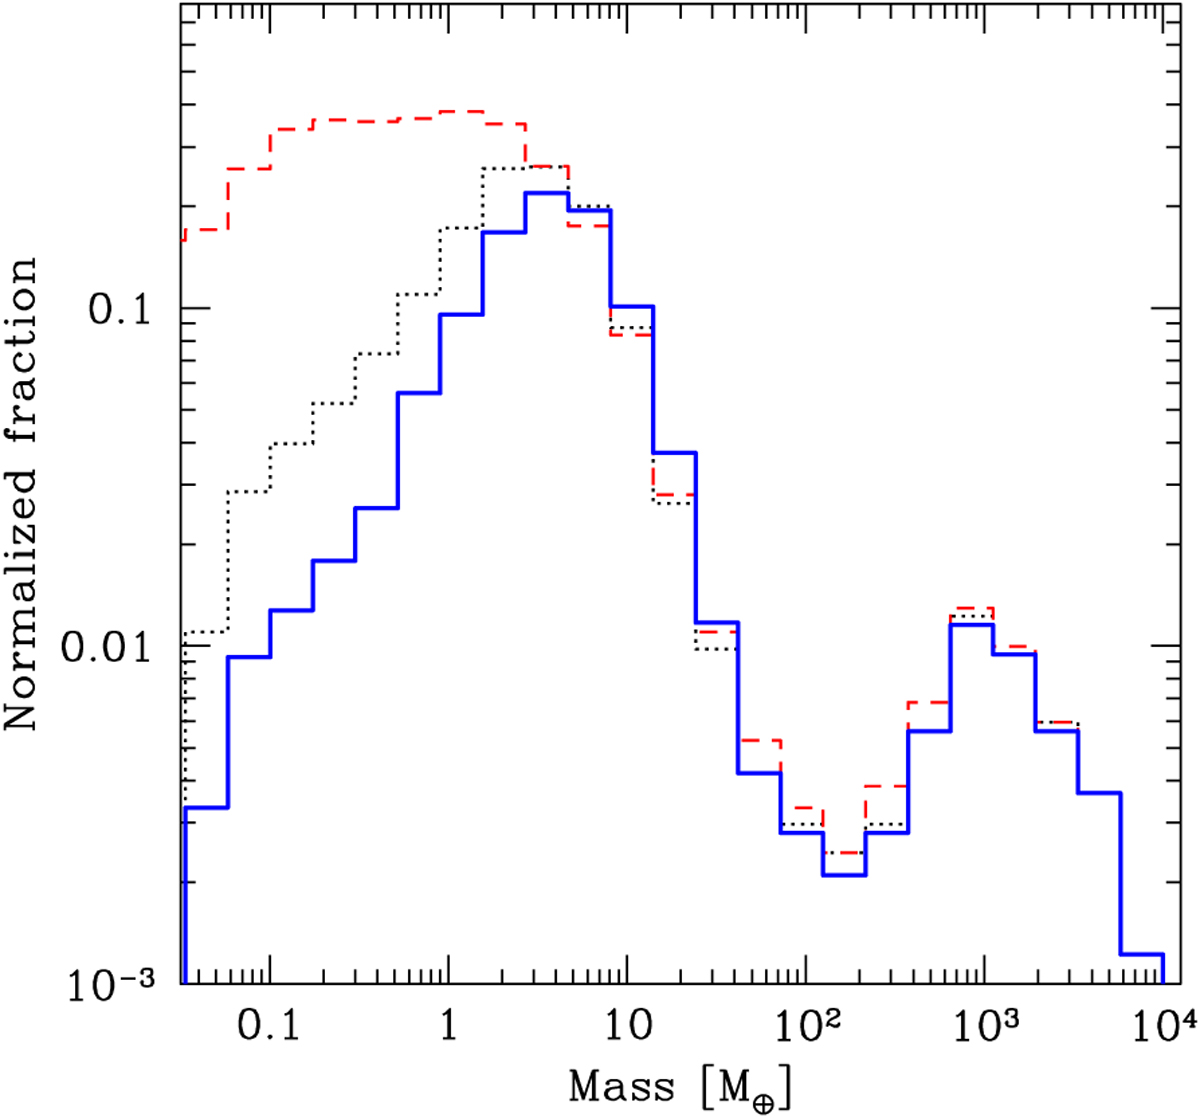
Unbiased mass function for planets within a < 3 au at three moments in time. The blue solid line shows the distribution at 100 Myr (NG76longshot) while the black dotted one is at 20 Myr (NG76). The red dashed line additionally shows the situation at the moment when the gas disc disappears in the systems (corresponding to 3 Myr on average). The reduction of the number of low-mass (proto)planets of mainly (sub-)Mars to Earth mass and the associated increase of more massive super-Earth and (sub-)Neptunian planets is visible. It is a consequence of giant impacts during the post-disc phase.
Current usage metrics show cumulative count of Article Views (full-text article views including HTML views, PDF and ePub downloads, according to the available data) and Abstracts Views on Vision4Press platform.
Data correspond to usage on the plateform after 2015. The current usage metrics is available 48-96 hours after online publication and is updated daily on week days.
Initial download of the metrics may take a while.