Fig. 5
Download original image
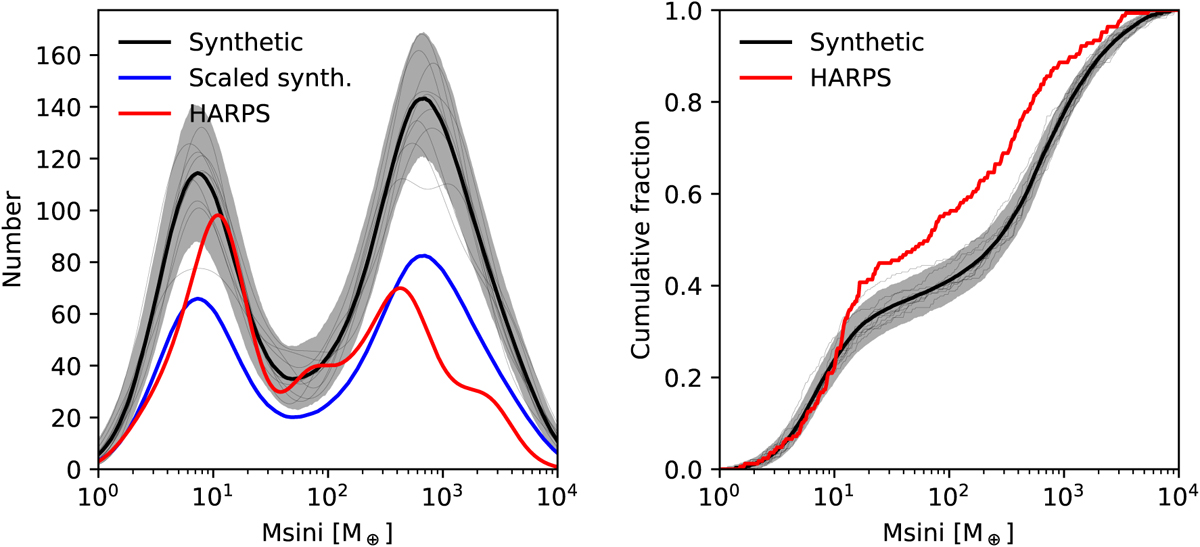
Comparison of the planet masses between the synthetic biased population (NG76, black) and the HARPS/Coralie sample (red). The data of the synthetic population is based on 1000 Monte Carlo synthetic observations, with the bold line showing the median of these, the grey region showing the 95% confidence interval, and the thin black lines indicating ten individual realisations. Left: kernel density estimate (scaled to be absolute) with a smoothing length of 0.19 dex, with the addition of the synthetic population scaled down to the same total number of planets as the observed sample (blue). Right: cumulative distributions of the same data. The statistical analysis shows that the samples from the synthetic population do not match the detected ones at the 5% level because the model under-predicts the number of sub-Neptunes and over-predicts the number of giants.
Current usage metrics show cumulative count of Article Views (full-text article views including HTML views, PDF and ePub downloads, according to the available data) and Abstracts Views on Vision4Press platform.
Data correspond to usage on the plateform after 2015. The current usage metrics is available 48-96 hours after online publication and is updated daily on week days.
Initial download of the metrics may take a while.