Fig. 7
Download original image
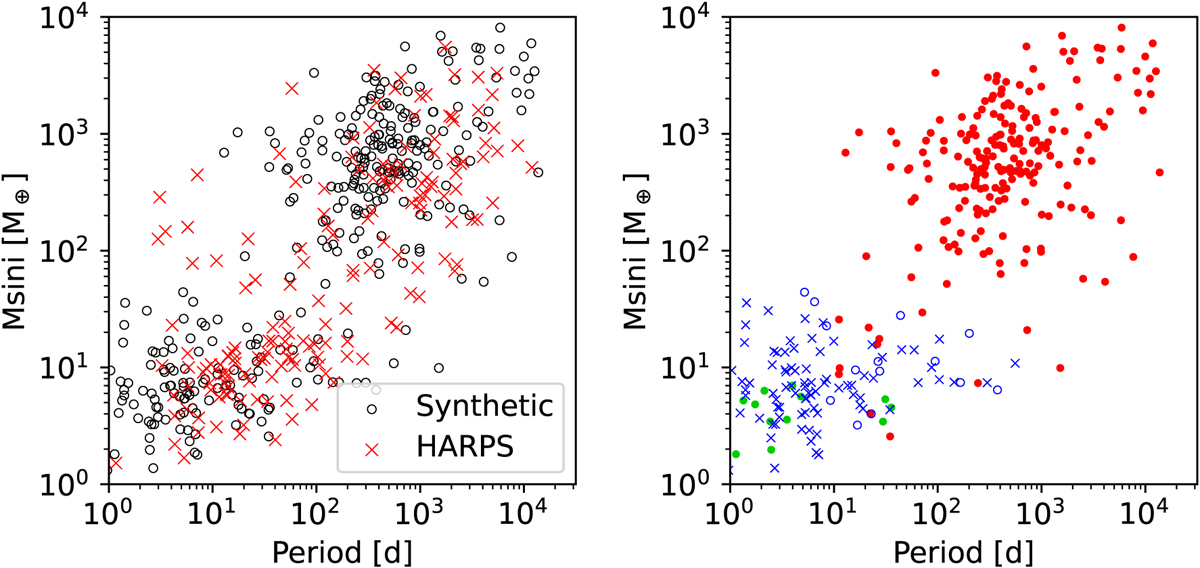
Left: comparison of the minimum mass (M sin i) versus orbital period of the biased synthetic 100-embryo population (NG76, black circles) and the actual HARPS/Coralie survey (red crosses; M11). Both samples have 822 systems. Right: same but only for the synthetic population and with different colours and symbols depending on planet properties. Red circles indicate planets whose H/He envelope content is larger than the core; otherwise, green circles are for planets whose cores do not contain any ices, and blue is for the planets whose cores contain ices. In the latter case, circles are for planets whose envelope mass is at least 10% that of the core, and crosses are for the others.
Current usage metrics show cumulative count of Article Views (full-text article views including HTML views, PDF and ePub downloads, according to the available data) and Abstracts Views on Vision4Press platform.
Data correspond to usage on the plateform after 2015. The current usage metrics is available 48-96 hours after online publication and is updated daily on week days.
Initial download of the metrics may take a while.