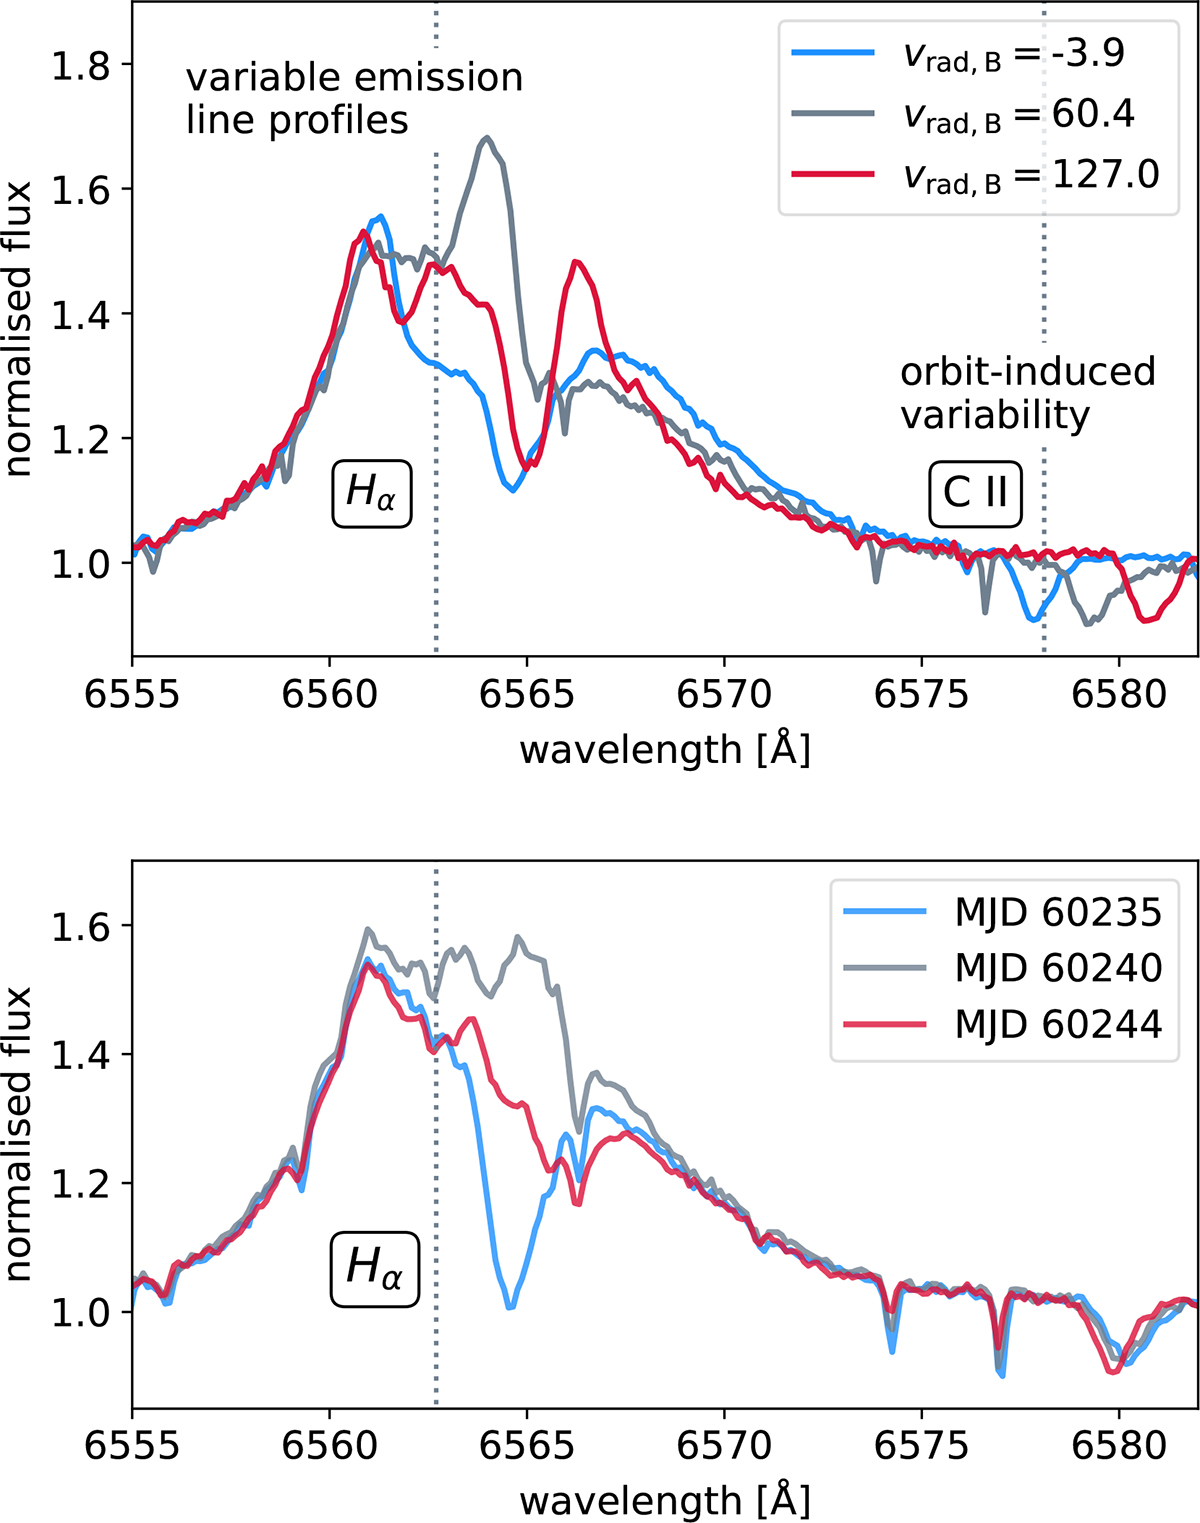
Fig. 1.
Download original image
Top: Balmer emission lines at quadrature. Two TRES spectra taken close to quadrature (red and blue lines) and one spectrum close to the system’s barycentric velocity (grey line). The grey dotted lines indicate the rest-frame wavelengths of the Balmer Hα and carbon C II 6572 lines. Orbital motion of the narrow-lined star is apparent from wavelength shifts in the C II lines, whereas the Hα line shows variable emission line profiles. Bottom: Short-term variability of emission line profiles. Three TRES spectra observed at t = MJD 60235, t + 5 d, and t + 9 d, that is, spanning < 5% of the orbital period. Solid grey, red, and blue lines show the variable Hα emission line profiles. The rest-frame wavelength of Hα is shown as in the top panel. Narrow lines at 6574, 6577 Å originate from variable telluric absorption.
Current usage metrics show cumulative count of Article Views (full-text article views including HTML views, PDF and ePub downloads, according to the available data) and Abstracts Views on Vision4Press platform.
Data correspond to usage on the plateform after 2015. The current usage metrics is available 48-96 hours after online publication and is updated daily on week days.
Initial download of the metrics may take a while.