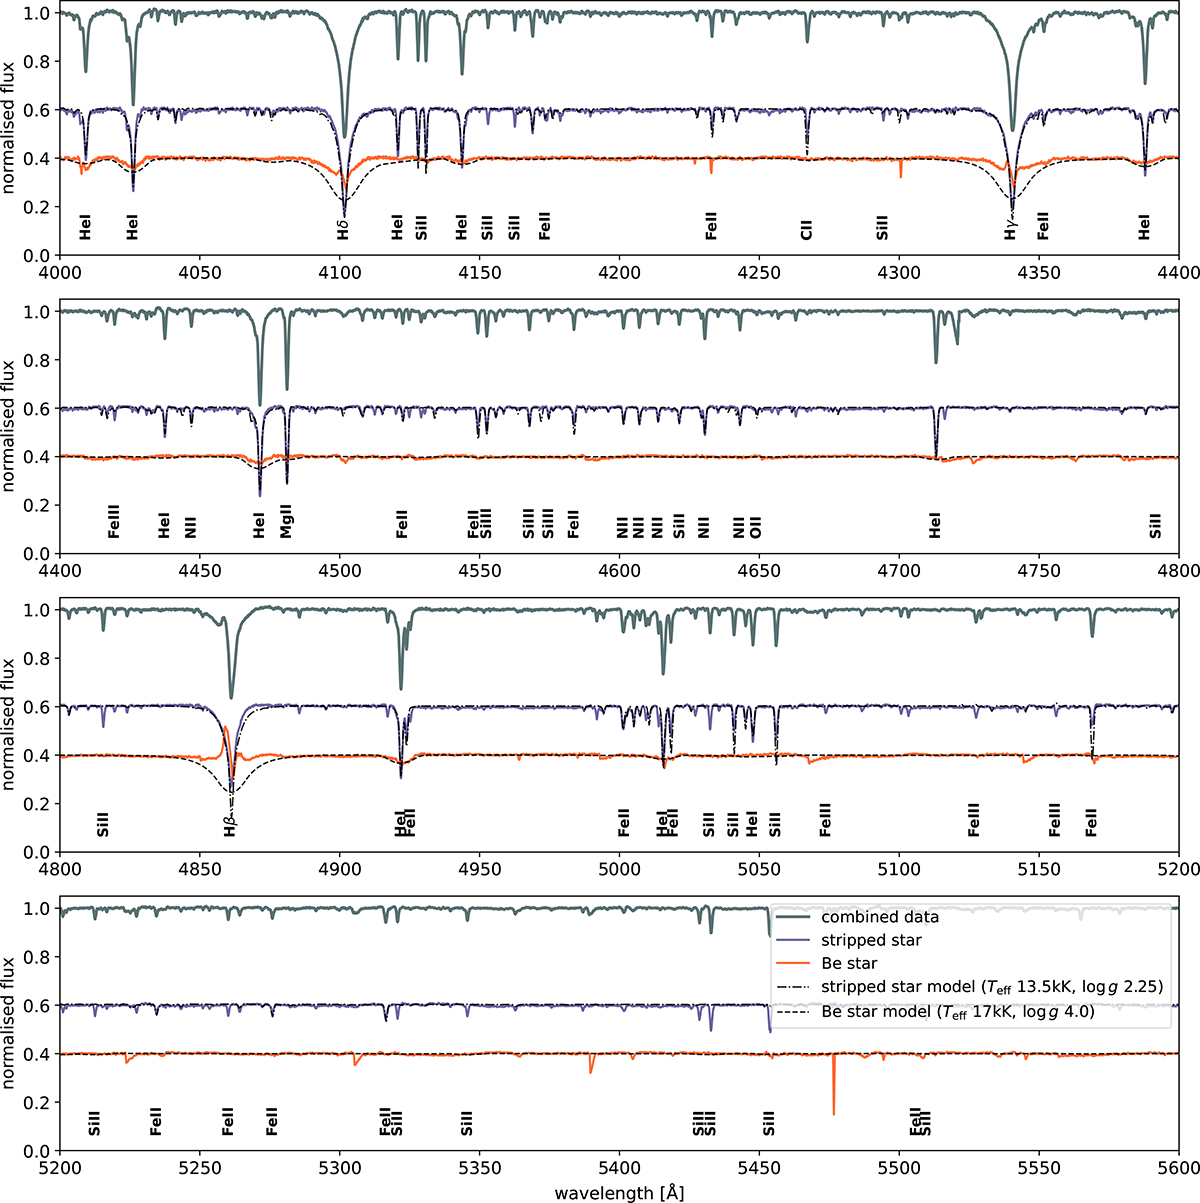
Fig. B.3.
Download original image
Full wavelength range of disentangled spectra and models. The disentangled spectra of the narrow-lined stripped star (dark blue) and the Be star (orange) are shown across the full wavelength range, scaled to their respective flux contributions. Overlaid are model spectra with the inferred parameters, plotted as dash-dotted and dashed lines, respectively. The observed spectra, co-added for improved S/N and shifted to the rest frame of the stripped star, are displayed in grey and normalised to a continuum level of one. Key spectral lines are labelled at the bottom. Narrow, unlabelled features in the Be star’s disentangled spectrum are spurious, primarily resulting from telluric and interstellar absorption lines, as well as artefacts from the disentangling process.
Current usage metrics show cumulative count of Article Views (full-text article views including HTML views, PDF and ePub downloads, according to the available data) and Abstracts Views on Vision4Press platform.
Data correspond to usage on the plateform after 2015. The current usage metrics is available 48-96 hours after online publication and is updated daily on week days.
Initial download of the metrics may take a while.