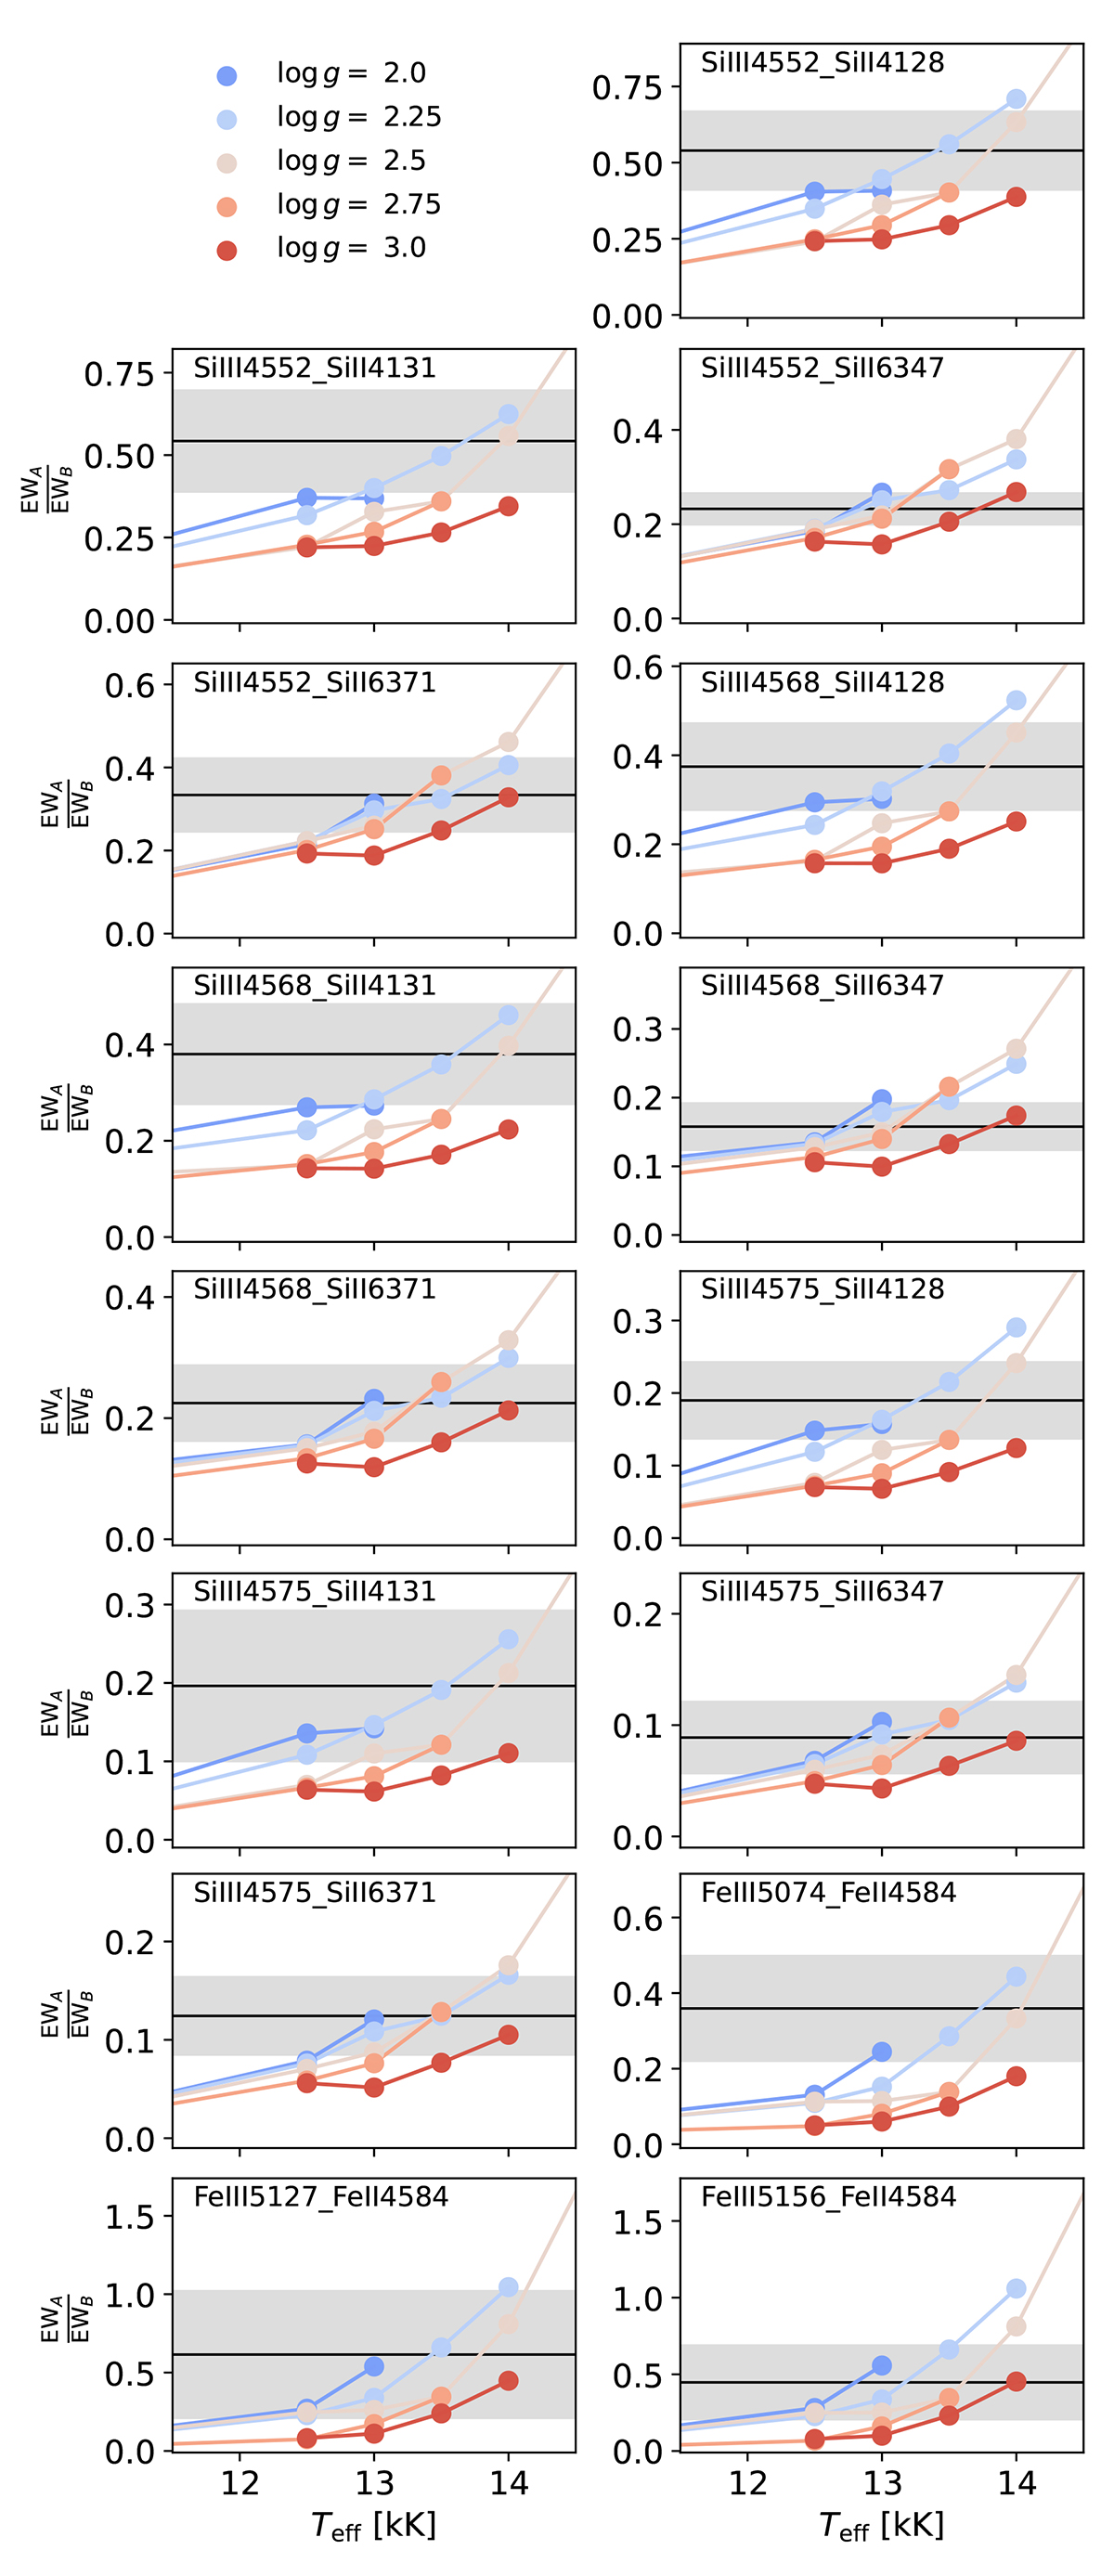
Fig. F.1.
Download original image
Temperature determination of the B star from ionisation equilibrium. The different panels are for different line combinations used to measure equivalent width ratios of Si III over Si II lines and Fe III over Fe II lines. The black line and shaded regions indicate the mean and uncertainties of the observed values. The coloured dots show the predicted ratios for the models of different logg as a function of Teff. For an estimated value of logg between ≈2.0 and 2.5, the best-fit Teff lies between 13000 and 14000 K, respectively.
Current usage metrics show cumulative count of Article Views (full-text article views including HTML views, PDF and ePub downloads, according to the available data) and Abstracts Views on Vision4Press platform.
Data correspond to usage on the plateform after 2015. The current usage metrics is available 48-96 hours after online publication and is updated daily on week days.
Initial download of the metrics may take a while.