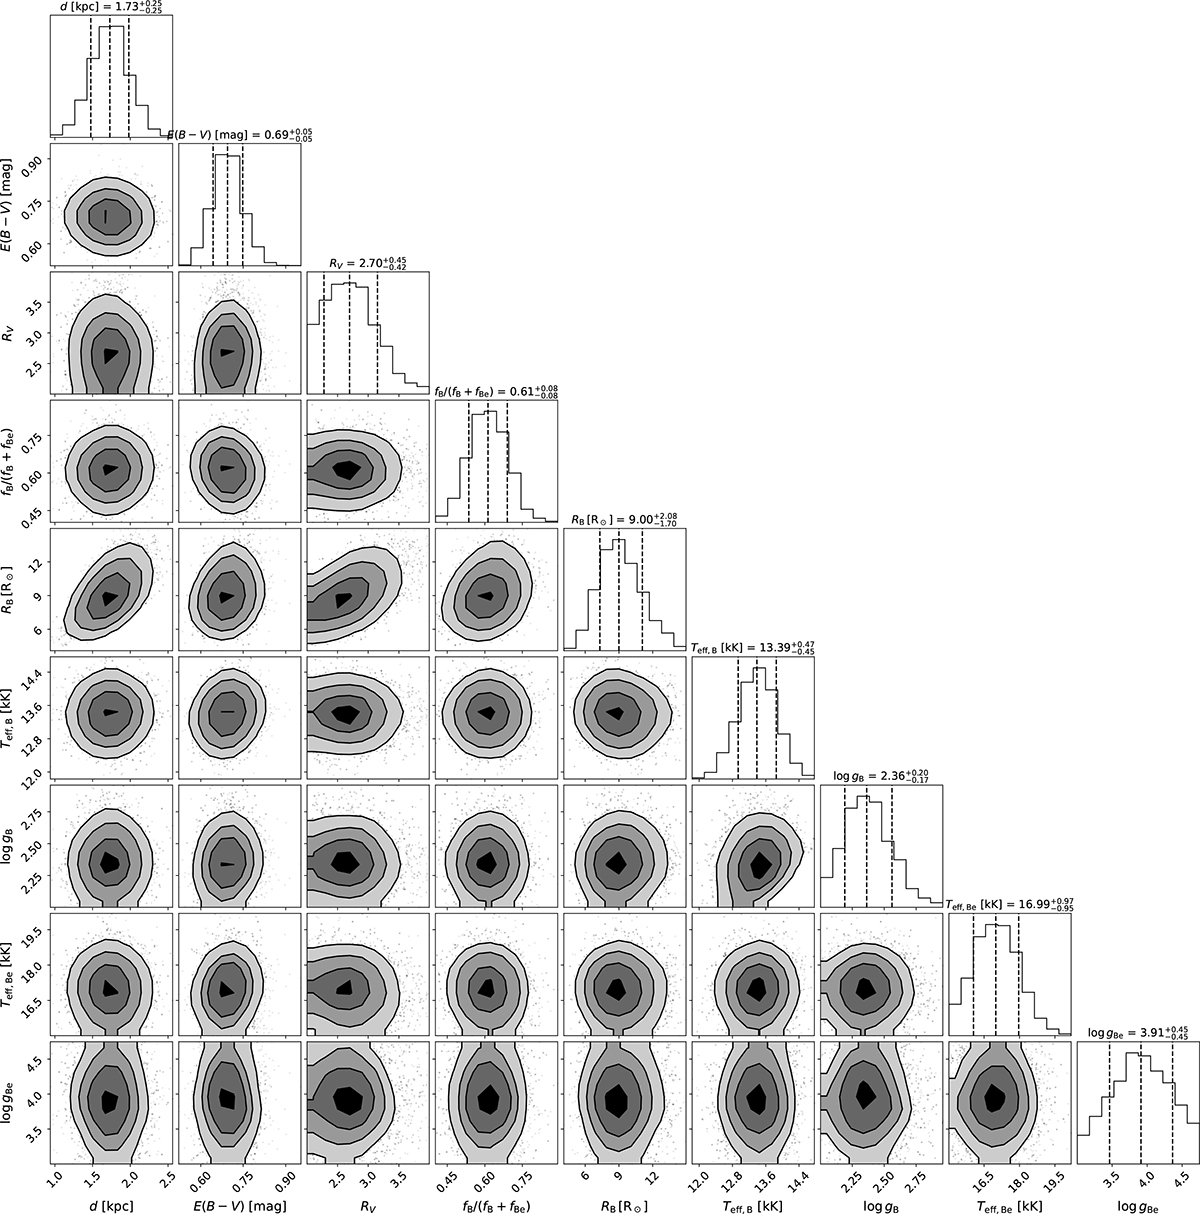
Fig. H.1.
Download original image
Corner plot visualising the binary parameter values and correlations inferred based on the SED photometry (see Sect. 7). Top panels in each column show histograms of posterior samples for individual parameters. Here, dashed lines mark median values and 1-σ confidence intervals. Central panels show the correlations of posterior samples for parameter pairs.
Current usage metrics show cumulative count of Article Views (full-text article views including HTML views, PDF and ePub downloads, according to the available data) and Abstracts Views on Vision4Press platform.
Data correspond to usage on the plateform after 2015. The current usage metrics is available 48-96 hours after online publication and is updated daily on week days.
Initial download of the metrics may take a while.