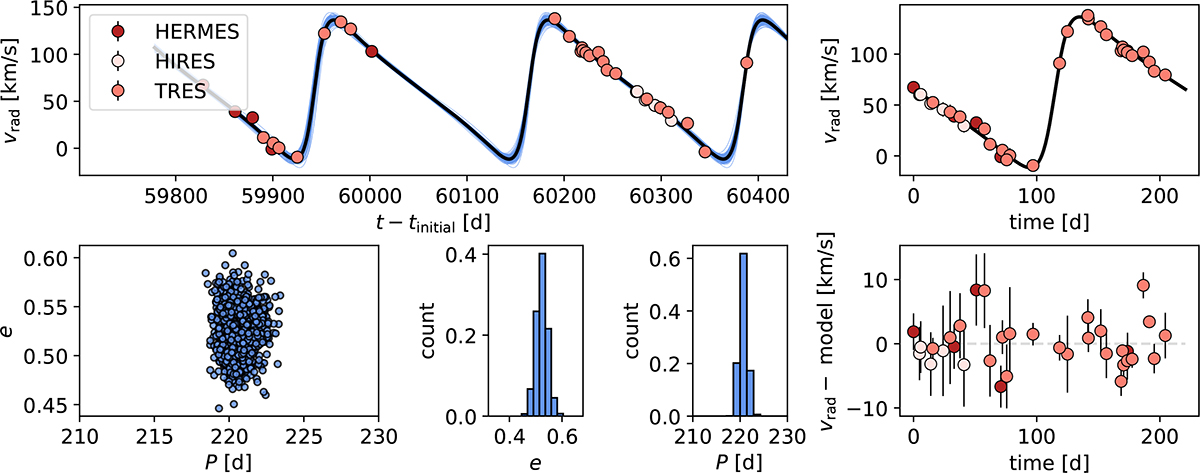
Fig. 3.
Download original image
Orbital analysis of HIP 15429. The top panel shows the RV time series, with data points colour-coded by the instrument used for observation, and RV orbit models computed from posterior samples (blue lines). The lower-left and middle panels show the posterior distributions for the orbital period, P, and eccentricity, e. The MAP model is indicated by the solid black line. The phase-folded RVs and residuals from the MAP model are shown in the right-hand panels.
Current usage metrics show cumulative count of Article Views (full-text article views including HTML views, PDF and ePub downloads, according to the available data) and Abstracts Views on Vision4Press platform.
Data correspond to usage on the plateform after 2015. The current usage metrics is available 48-96 hours after online publication and is updated daily on week days.
Initial download of the metrics may take a while.