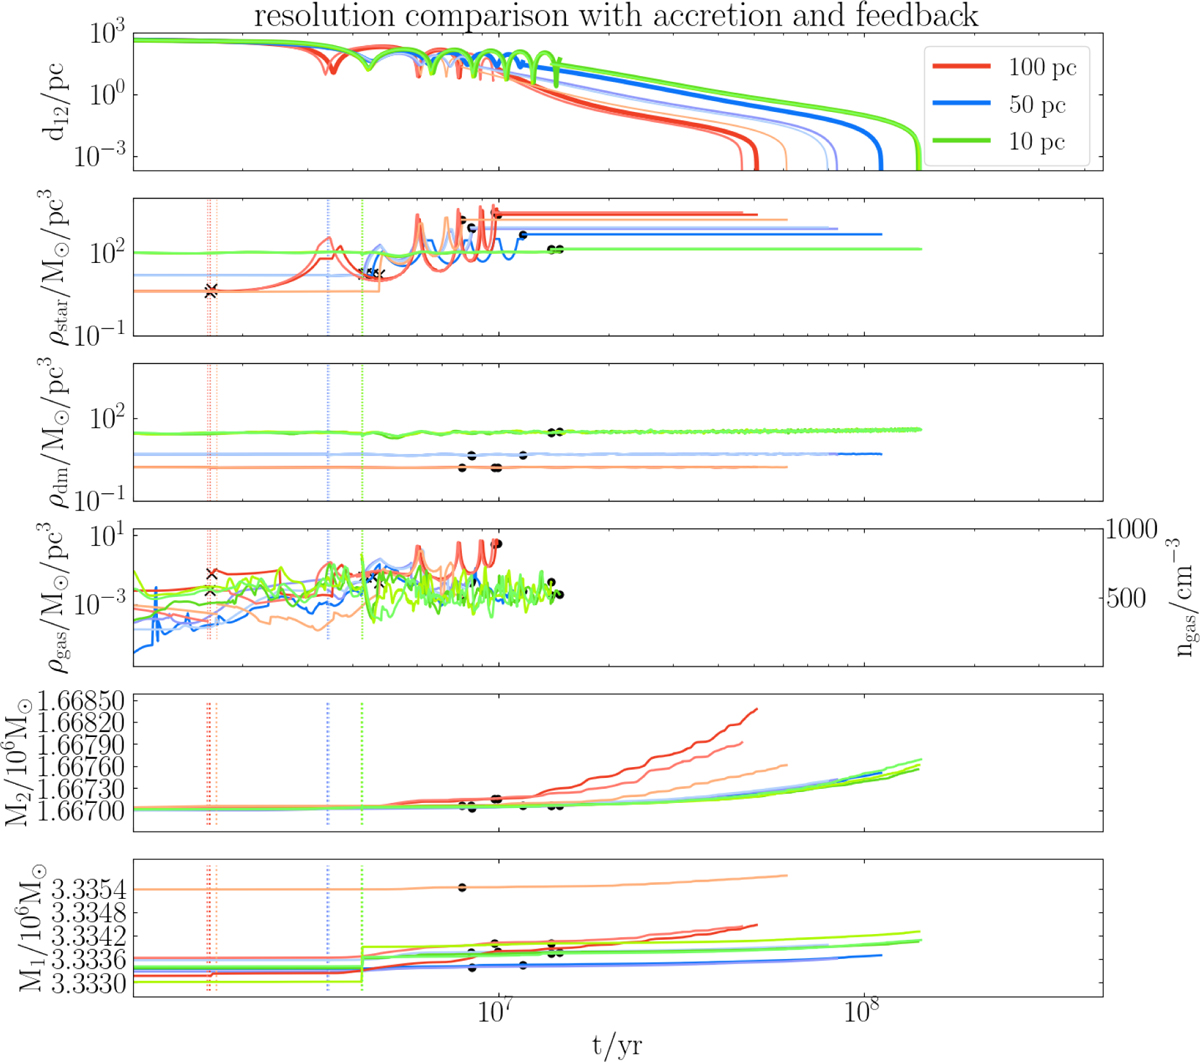
Fig. 3
Download original image
Same as Fig. 2, but for the counterpart results with accretion and feedback. The top panel shows the MBH separation time evolution. The second, third, and fourth panels show the stellar, DM, and gas density, respectively, used to calculate the DF on the secondary MBH. The black crosses indicate the triggering of subgrid density profiles. The fifth and sixth panels show the mass growth of the primary and secondary MBHs, respectively. The black dots indicate the transition from stage 1 to stage 2 in RAMCOAL.
Current usage metrics show cumulative count of Article Views (full-text article views including HTML views, PDF and ePub downloads, according to the available data) and Abstracts Views on Vision4Press platform.
Data correspond to usage on the plateform after 2015. The current usage metrics is available 48-96 hours after online publication and is updated daily on week days.
Initial download of the metrics may take a while.