Fig. 1
Download original image
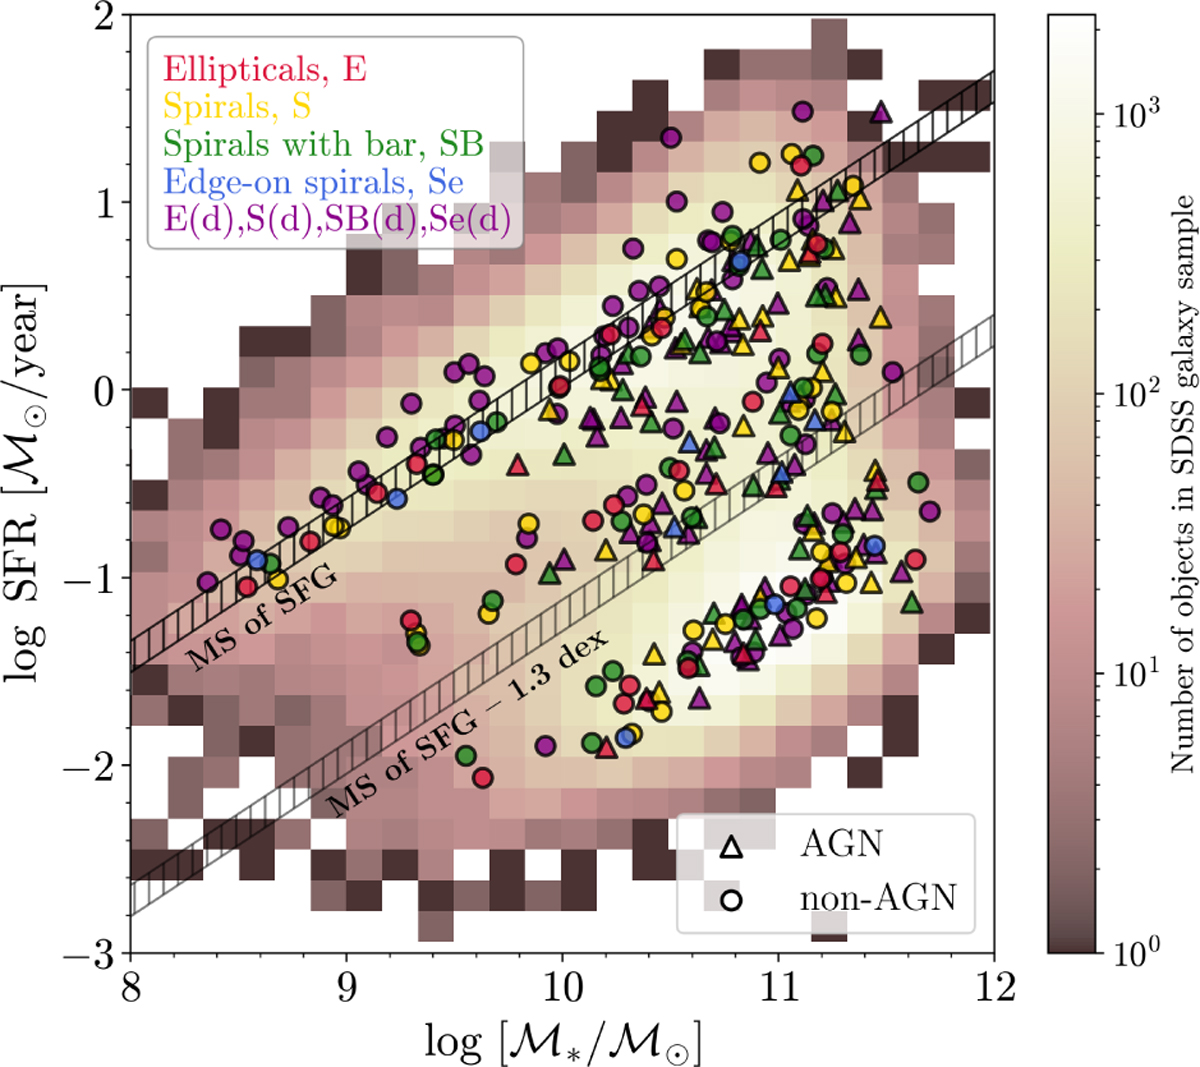
Distribution of SFR vs. stellar mass for 100 000 galaxies in our sample. The individual target objects selected for our study are shown in different colours and shapes depending on the GZ2 morphology class (from red to purple) and on the AGN or non-AGN selection according to the BPT-diagram criteria (triangle and circle). The shaded black band presents the MS of SFG defined by Eq. (1). The shaded grey band shows a cut at 1.3 dex below the MS of SFG applied to separate the galaxies into star-forming and quiescent galaxy populations. Both areas correspond to the redshift interval z = 0.01-0.15.
Current usage metrics show cumulative count of Article Views (full-text article views including HTML views, PDF and ePub downloads, according to the available data) and Abstracts Views on Vision4Press platform.
Data correspond to usage on the plateform after 2015. The current usage metrics is available 48-96 hours after online publication and is updated daily on week days.
Initial download of the metrics may take a while.