Fig. B.1
Download original image
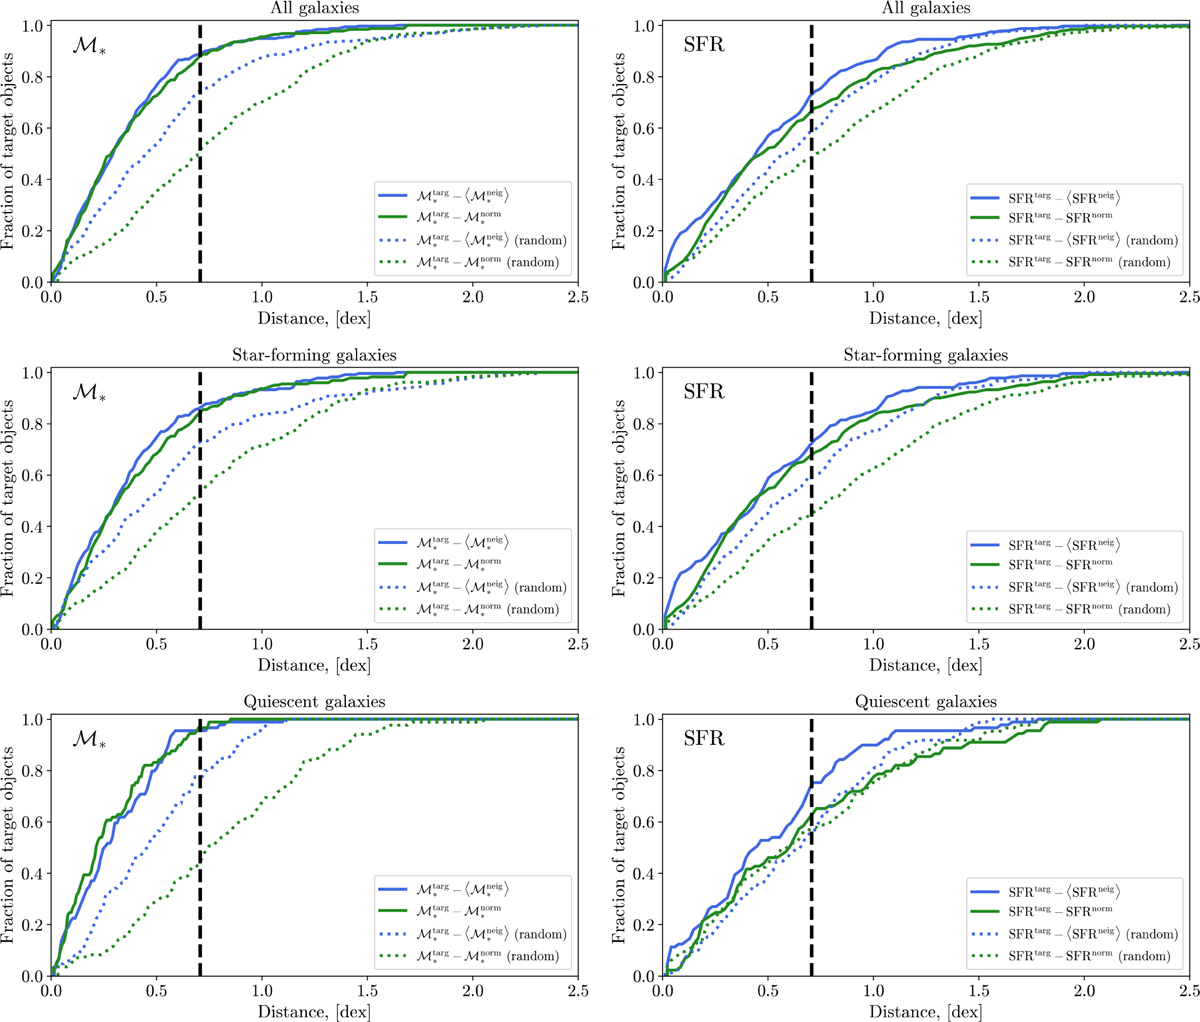
Left panel: The distributions of distances between the mean and the normalised mean ℳ* for the retrieved neighbours and the target object, i.e. ![]() (by blue colour) and
(by blue colour) and ![]() (by green colour), for all, star-forming and quiescent subsamples of target objects. The black dashed line represents the cut at 1 dex/
(by green colour), for all, star-forming and quiescent subsamples of target objects. The black dashed line represents the cut at 1 dex/![]() used to define ULISSE efficiency (see description in Section 4.3). Right panel: The same as on the left panel, but for SFRtarg - ⟨SFRneig⟩ and SFRtarg - SFRnorm.
used to define ULISSE efficiency (see description in Section 4.3). Right panel: The same as on the left panel, but for SFRtarg - ⟨SFRneig⟩ and SFRtarg - SFRnorm.
Current usage metrics show cumulative count of Article Views (full-text article views including HTML views, PDF and ePub downloads, according to the available data) and Abstracts Views on Vision4Press platform.
Data correspond to usage on the plateform after 2015. The current usage metrics is available 48-96 hours after online publication and is updated daily on week days.
Initial download of the metrics may take a while.