Fig. 3
Download original image
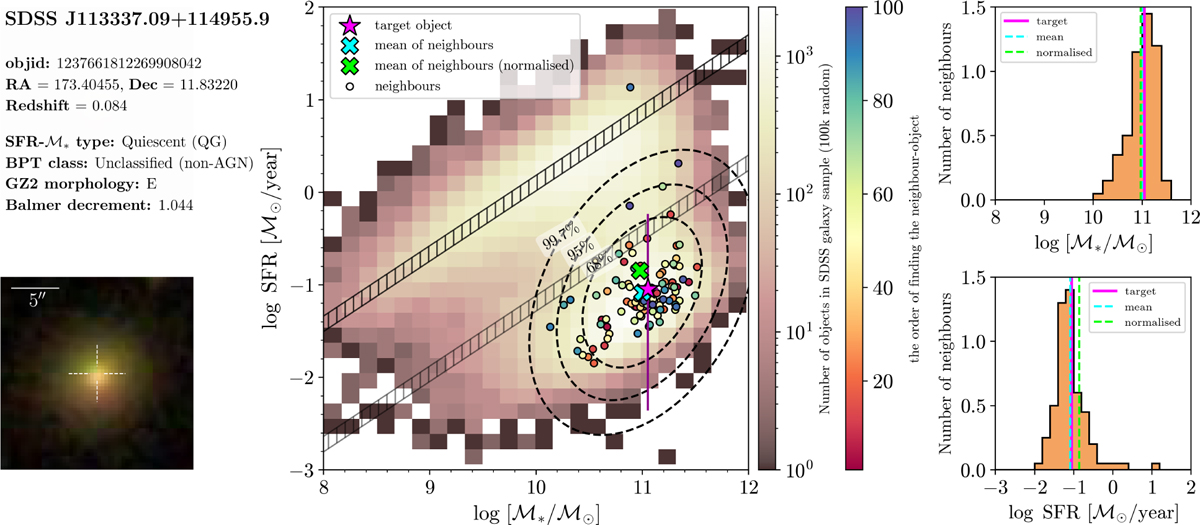
Left: properties of target object 1 with its classification according to the criteria presented in Section 3.1 (upper panel) and the SDSS thumbnail used for the analysis by ULISSE (lower panel). Centre: distribution of SFR versus stellar mass for 100 000 galaxies in our sample. The position of the target in the SFR-ℳ* diagram (with 1σ errors) is presented as a magenta star together with 100 nearest neighbours (circles). The colour of the circles represents the order in which each neighbour was retrieved by ULISSE. The cyan and green crosses show the position of the mean and normalised mean position for 100 neighbours, respectively. Ellipses enclosing 68%, 95%, and 99.7% of the retrieved neighbours are shown by black dashed lines. The estimated distances for this target are presented in Table 2. The grey- and black-shaded areas are the same as in Fig. 1. Right: distributions of ℳ* (upper panel) and SFR (lower panel) for 100 neighbours retrieved by ULISSE, normalised to the number of neighbours. Vertical lines show the corresponding values of ℳ* or SFR for the target object (magenta), the arithmetic mean (cyan), and the normalised mean (green) of the neighbour distributions.
Current usage metrics show cumulative count of Article Views (full-text article views including HTML views, PDF and ePub downloads, according to the available data) and Abstracts Views on Vision4Press platform.
Data correspond to usage on the plateform after 2015. The current usage metrics is available 48-96 hours after online publication and is updated daily on week days.
Initial download of the metrics may take a while.