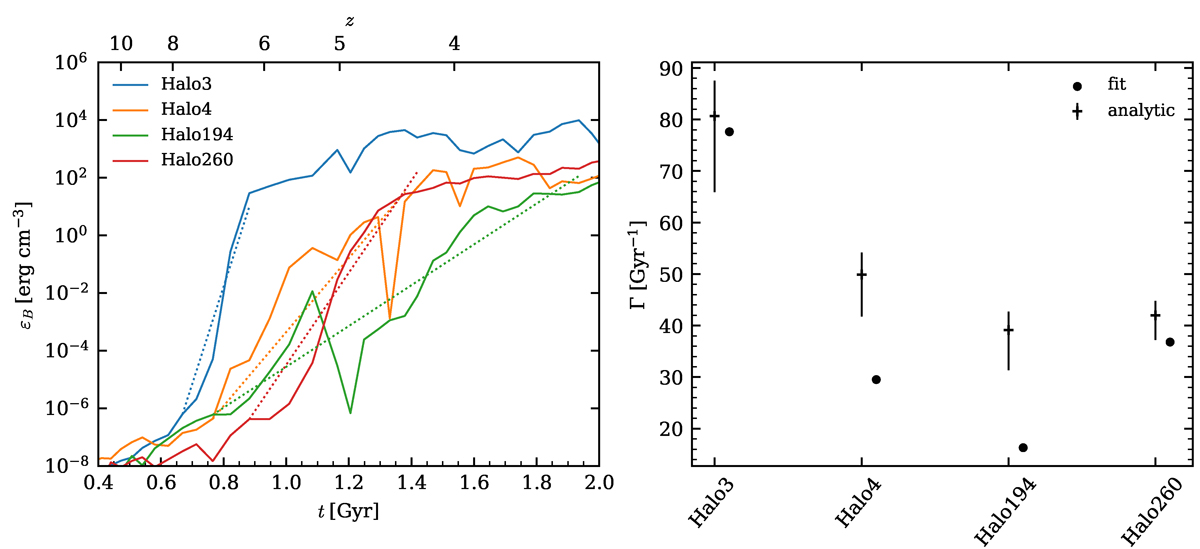
Fig. 10.
Download original image
Left: Time evolution of the magnetic energy density with fits of the exponential growth rates for the ISM in all four halos (dotted lines). The fits started when the magnetic energy density for the first time grew to a value at or above 4 × 10⁻⁷ erg cm−3 and ended when the magnetic energy density for the first time reached a value of at least 40 erg cm−3. We subtracted the contributions from adiabatic compression following the relation given in equation (7), where we fixed B0 and ρ0 to be the measured values after the cluster collapse, and εB(t), ρ(t) were measured in each snapshot. Right: Fit growth rates (circles) along with the expected growth rates (crosses) that include error bars as described in the text. Our analytic and measured growth rates agree within a factor of two, with the expected growth rates slightly larger than the measurements.
Current usage metrics show cumulative count of Article Views (full-text article views including HTML views, PDF and ePub downloads, according to the available data) and Abstracts Views on Vision4Press platform.
Data correspond to usage on the plateform after 2015. The current usage metrics is available 48-96 hours after online publication and is updated daily on week days.
Initial download of the metrics may take a while.