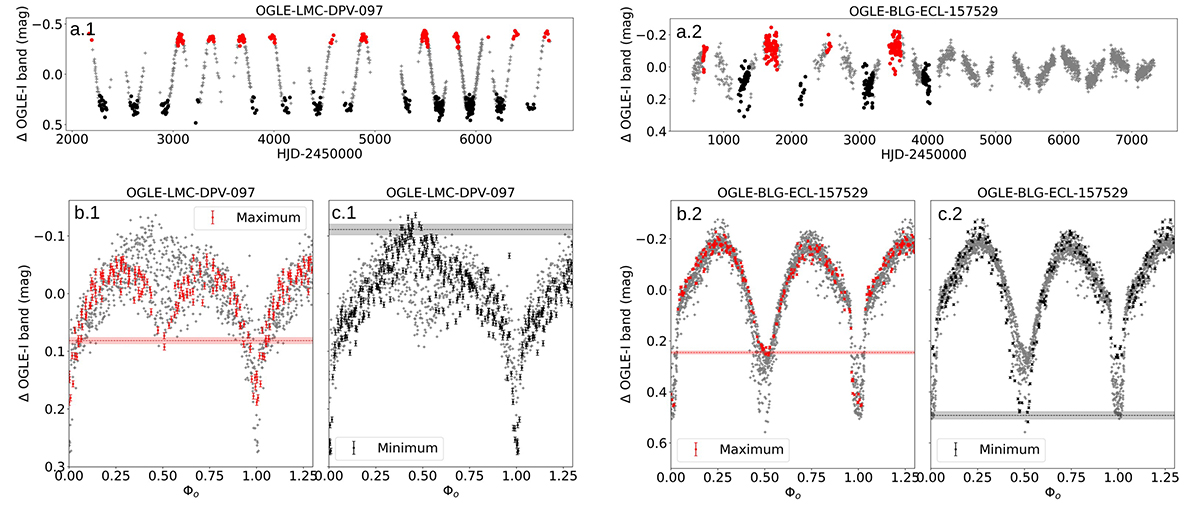
Fig. 1.
Download original image
Long cycle after the separation for OGLE-LMC-DPV-097 and OGLE-BLG-ECL-157529 (panels a.1 and a.2). The red and black dots indicate the observation epochs corresponding to the maximum and minimum of the long cycle according to the ranges defined in Sect. 3.3. Panels b.1, b.2, c.1, and c.2 present the orbital light curves during the maximum and minimum phases of the long cycle for the two systems. The dashed line marks the estimated magnitude near orbital phase Φo ∼ 0.5, and the shaded region represents the 1σ confidence interval (see Sect. 3.4). The grey dots in panels b.1, b.2, c.1, and c.2 correspond to the same observation epochs as in panels a.1 and a.2. For OGLE-BLG-ECL-157529, only epochs with the largest long-cycle amplitude are displayed (see panel a.2).
Current usage metrics show cumulative count of Article Views (full-text article views including HTML views, PDF and ePub downloads, according to the available data) and Abstracts Views on Vision4Press platform.
Data correspond to usage on the plateform after 2015. The current usage metrics is available 48-96 hours after online publication and is updated daily on week days.
Initial download of the metrics may take a while.