Fig. 2.
Download original image
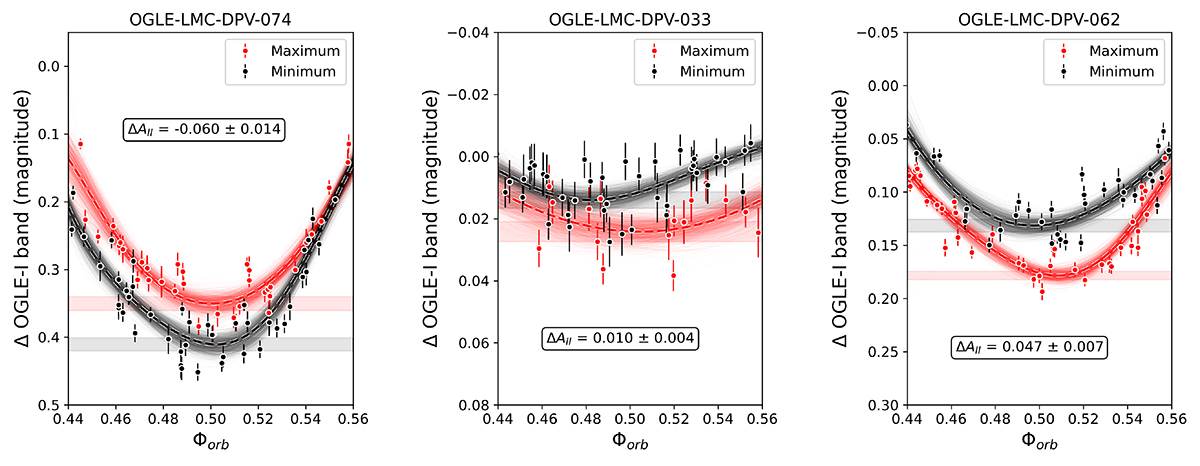
Photometry of the orbital cycle around orbital phase 0.5 for three DPVs: OGLE-LMC-DPV-074 (left panel), OGLE-LMC-DPV-033 (middle panel), and OGLE-LMC-DPV-062 (right panel). The dashed red and black lines represent the best polynomial fits to the data at the maximum and minimum phases of the long cycle, respectively. The solid lines correspond to 1000 bootstrap realisations that we used to estimate the uncertainty, and the shaded region indicates the resulting 1σ confidence interval (see details in Sect. 3.4). The quantity ΔAII is derived using Eq. (1).
Current usage metrics show cumulative count of Article Views (full-text article views including HTML views, PDF and ePub downloads, according to the available data) and Abstracts Views on Vision4Press platform.
Data correspond to usage on the plateform after 2015. The current usage metrics is available 48-96 hours after online publication and is updated daily on week days.
Initial download of the metrics may take a while.