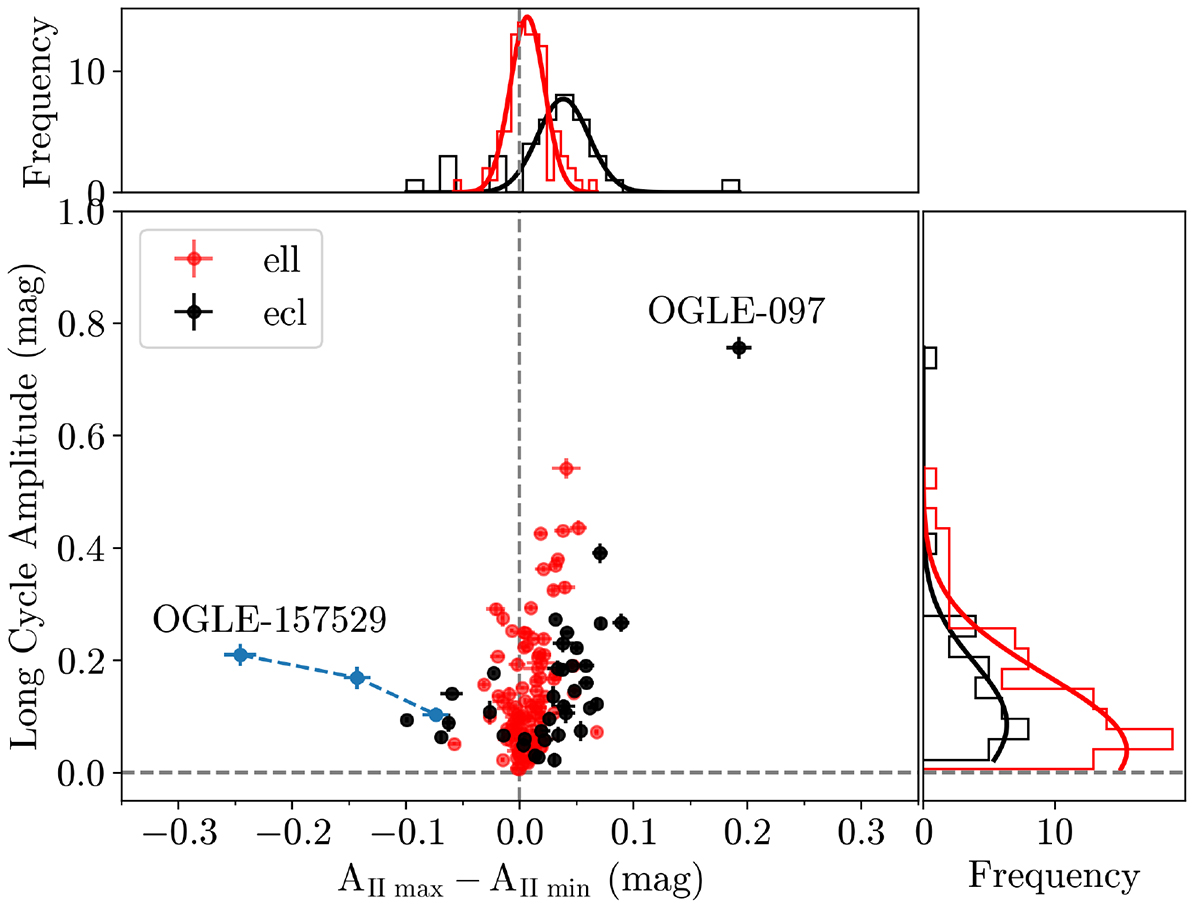
Fig. 3.
Download original image
ΔAII vs. long-cycle amplitude in the OGLE I band. The red and black dots represent binary systems classified as ellipsoidal and eclipsing, respectively. In addition, we show the location of OGLE-LMC-DPV-097 and OGLE-BLG-ECL-157529, as they represent extreme cases of changes in the morphology of the light curve. The dashed blue line traces the case of OGLE-BLG-ECL-157529, whose decrease in the long-cycle amplitude is associated with a reduced ΔAII.
Current usage metrics show cumulative count of Article Views (full-text article views including HTML views, PDF and ePub downloads, according to the available data) and Abstracts Views on Vision4Press platform.
Data correspond to usage on the plateform after 2015. The current usage metrics is available 48-96 hours after online publication and is updated daily on week days.
Initial download of the metrics may take a while.