Fig. 8.
Download original image
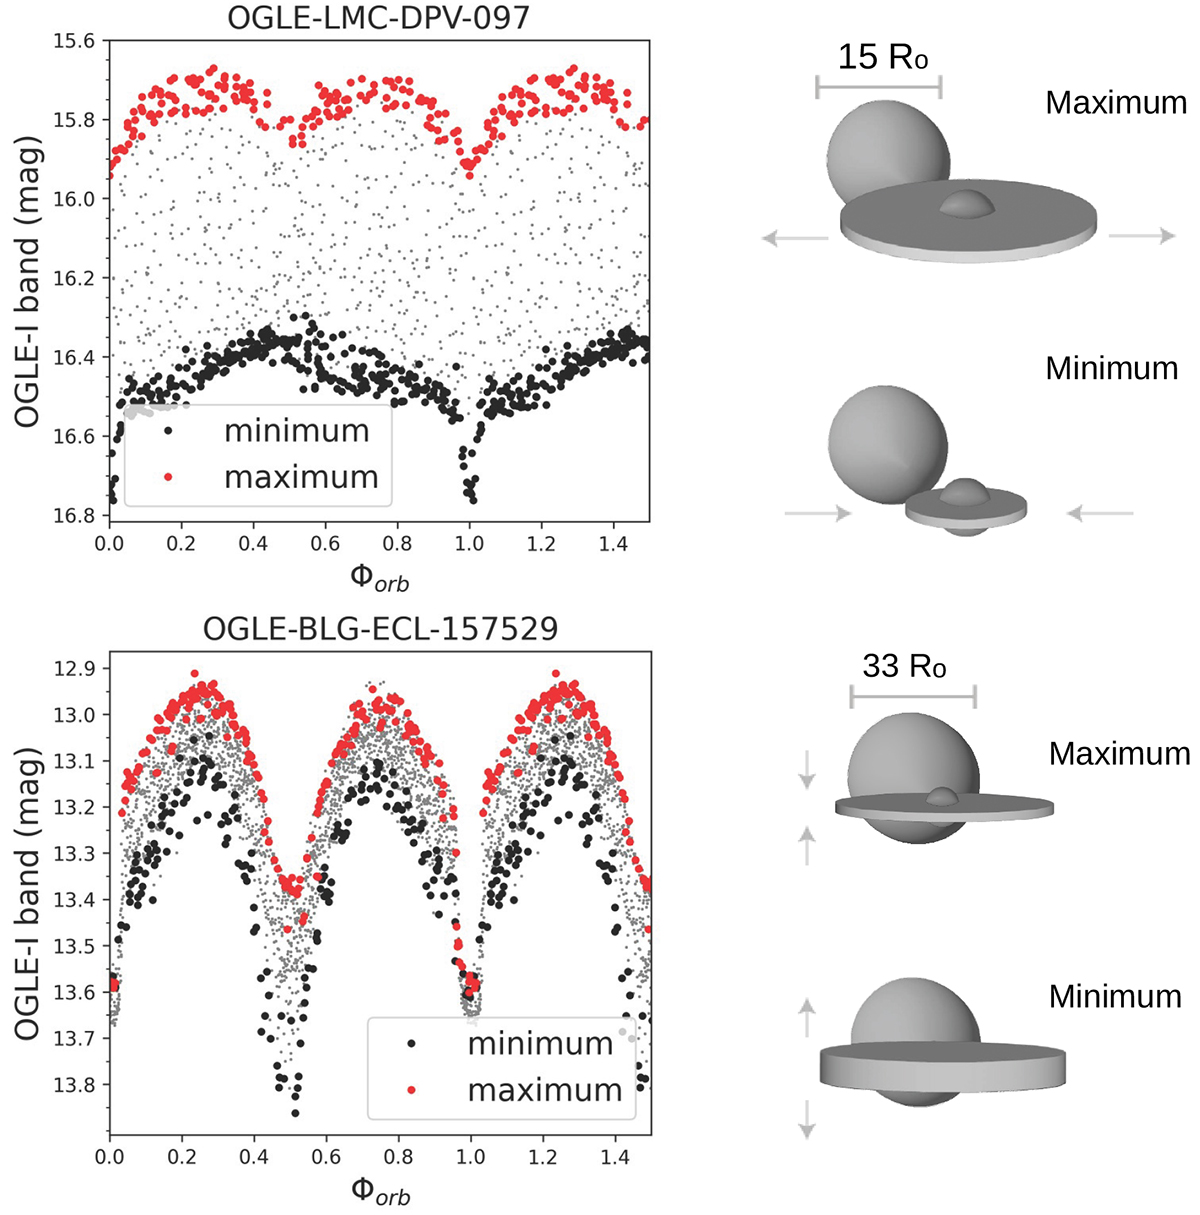
Top left: Orbital phase vs. magnitude in the OGLE I band for OGLE-LMC-DPV-097. The red points show the maximum of the long cycle, and the black points show the minimum. The grey dots represent other phases of the long cycle. Top right: Comparative illustration of the binary system at orbital phase 0.55 in the maximum and minimum phases of the long cycle based on the orbital light-curve models of Garcés et al. (2018). Bottom left: Same as above, but for OGLE-BLG-ECL-157529. Bottom right: Behaviour of the accretion disc in OGLE-BLG-ECL-157529 according to the best-fitting orbital light-curve models LC-4 (long-cycle minimum) and LC-7 (maximum) from Mennickent & Djurašević (2021, see Table A.1 of that study).
Current usage metrics show cumulative count of Article Views (full-text article views including HTML views, PDF and ePub downloads, according to the available data) and Abstracts Views on Vision4Press platform.
Data correspond to usage on the plateform after 2015. The current usage metrics is available 48-96 hours after online publication and is updated daily on week days.
Initial download of the metrics may take a while.