Fig. A.1.
Download original image
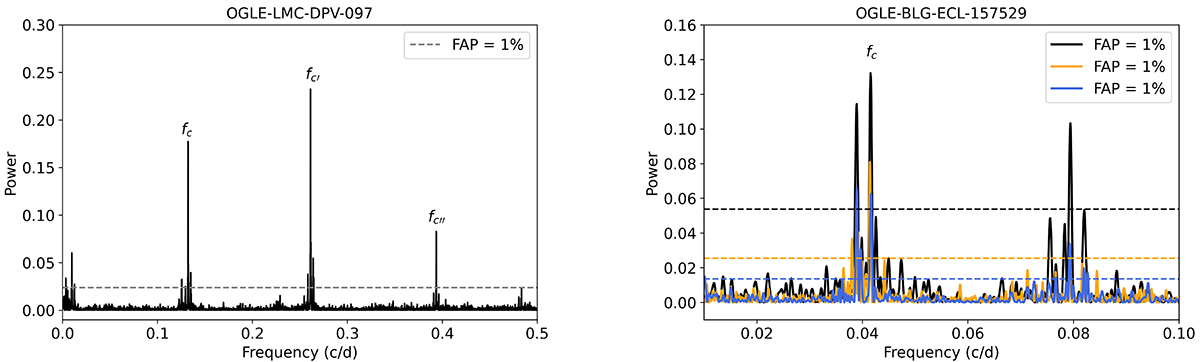
Left: GLS periodogram of the residual data of OGLE-LMC-DPV-097. Different frequency combinations are shown: fc = fo + fl, fc′ = 2fo + fl, and fc″ = 3fo + 2fl. Right: GLS periodogram of the OGLE-BLG-ECL-157529 residuals for different sets of OGLE I band photometric data. The first set ranges from HJD 500 to 4000 (black line), the second from 4000 to 5050 (orange line), and the last from 5060 to 7500 (blue line). For more details, see Section 4.3.
Current usage metrics show cumulative count of Article Views (full-text article views including HTML views, PDF and ePub downloads, according to the available data) and Abstracts Views on Vision4Press platform.
Data correspond to usage on the plateform after 2015. The current usage metrics is available 48-96 hours after online publication and is updated daily on week days.
Initial download of the metrics may take a while.