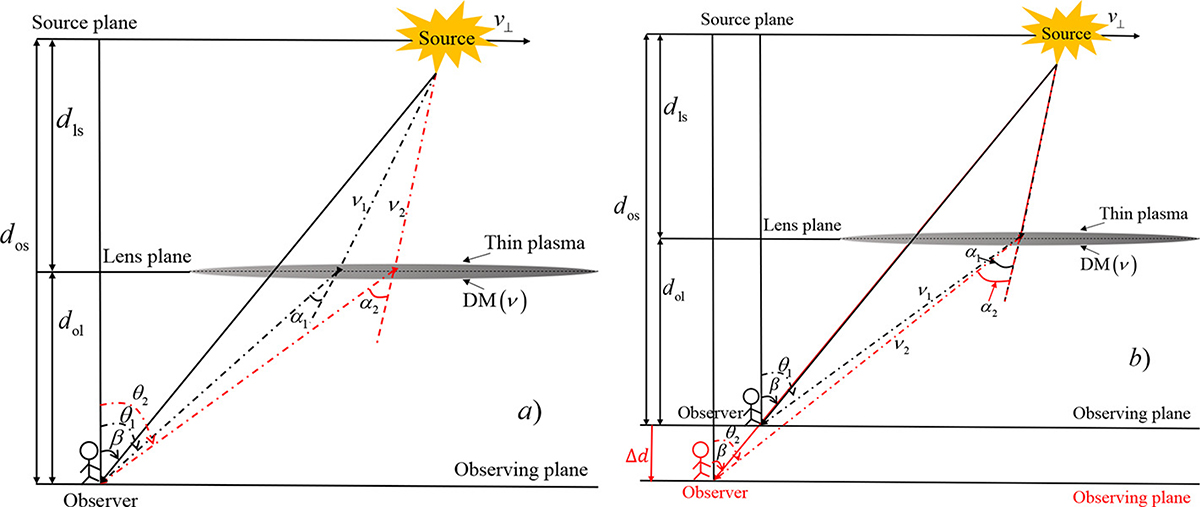
Fig. 1.
Download original image
Schematic representation of plasma-lensing geometries. Grey disc stands for plasma lens, and darker region is for higher plasma medium. Panel a: Proposed model, showing frequency-dependent paths through the lens, where signals at frequencies ν1 and ν2 (black and red dot-dashed lines) encounter different electron densities. Panel b: Traditional model assuming frequency-independent paths. Solid lines show undeflected paths, αi and θi denote the deflection angles and image positions (i = 1, 2), while Δd indicates the separation between observers.
Current usage metrics show cumulative count of Article Views (full-text article views including HTML views, PDF and ePub downloads, according to the available data) and Abstracts Views on Vision4Press platform.
Data correspond to usage on the plateform after 2015. The current usage metrics is available 48-96 hours after online publication and is updated daily on week days.
Initial download of the metrics may take a while.