Fig. 10.
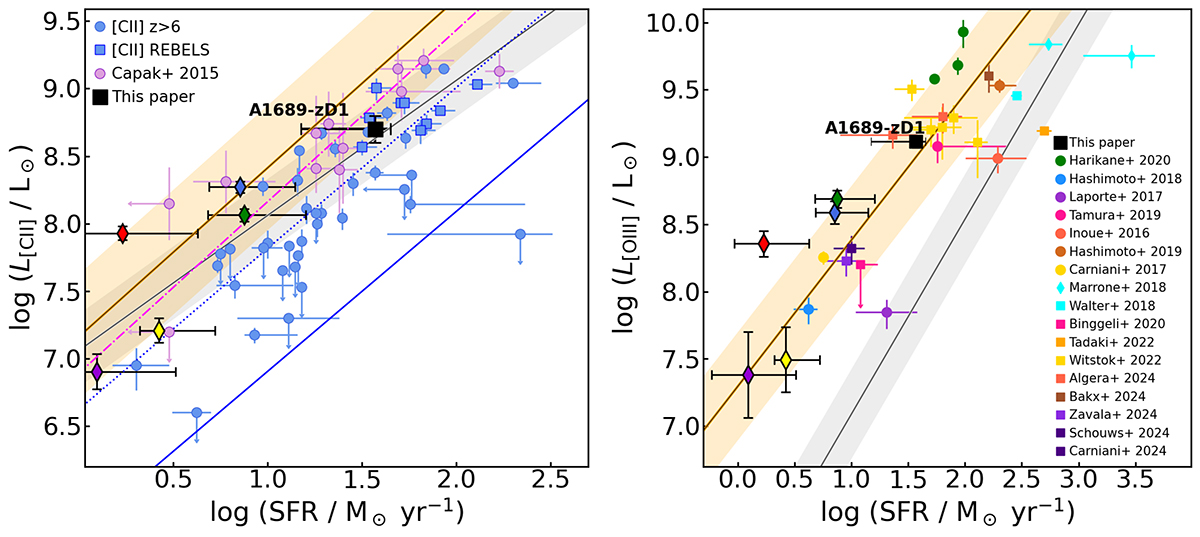
Download original image
Line luminosity vs. SFR for L[CII] (left) and L[OIII] (right). Black outline diamonds with color centers indicate the color-coded individual components from Sect. 3.5. The uncertainty on the SFR-axis for each component corresponds to the range given by a Tdust = 25 − 55 K. The orange and gray lines and associated regions show the relations for star-forming galaxies and low-metallicity dwarf galaxies from De Looze et al. (2014). Data from the literature is included for comparison for high-z galaxies without AGNs (Capak et al. 2015; Inoue et al. 2016; Knudsen et al. 2016; Pentericci et al. 2016; Bradač et al. 2017; Laporte et al. 2017, 2019, 2021; Carniani et al. 2017; Smit et al. 2018; Walter et al. 2018; Hashimoto et al. 2018, 2019; Tamura et al. 2019; Harikane et al. 2020; Binggeli et al. 2021; Fujimoto et al. 2021; Molyneux et al. 2022). We note that the data from the REBELS survey include the sources with L[CII] and UV + IR SED-estimated SFR (Sommovigo et al. 2022; Ferrara et al. 2022). On the right panel, for [O III] we also include the results from Marrone et al. (2018). In the left panel, the blue and magenta lines represent model predictions from Vallini et al. (2015) and Olsen et al. (2017).
Current usage metrics show cumulative count of Article Views (full-text article views including HTML views, PDF and ePub downloads, according to the available data) and Abstracts Views on Vision4Press platform.
Data correspond to usage on the plateform after 2015. The current usage metrics is available 48-96 hours after online publication and is updated daily on week days.
Initial download of the metrics may take a while.