Fig. 12.
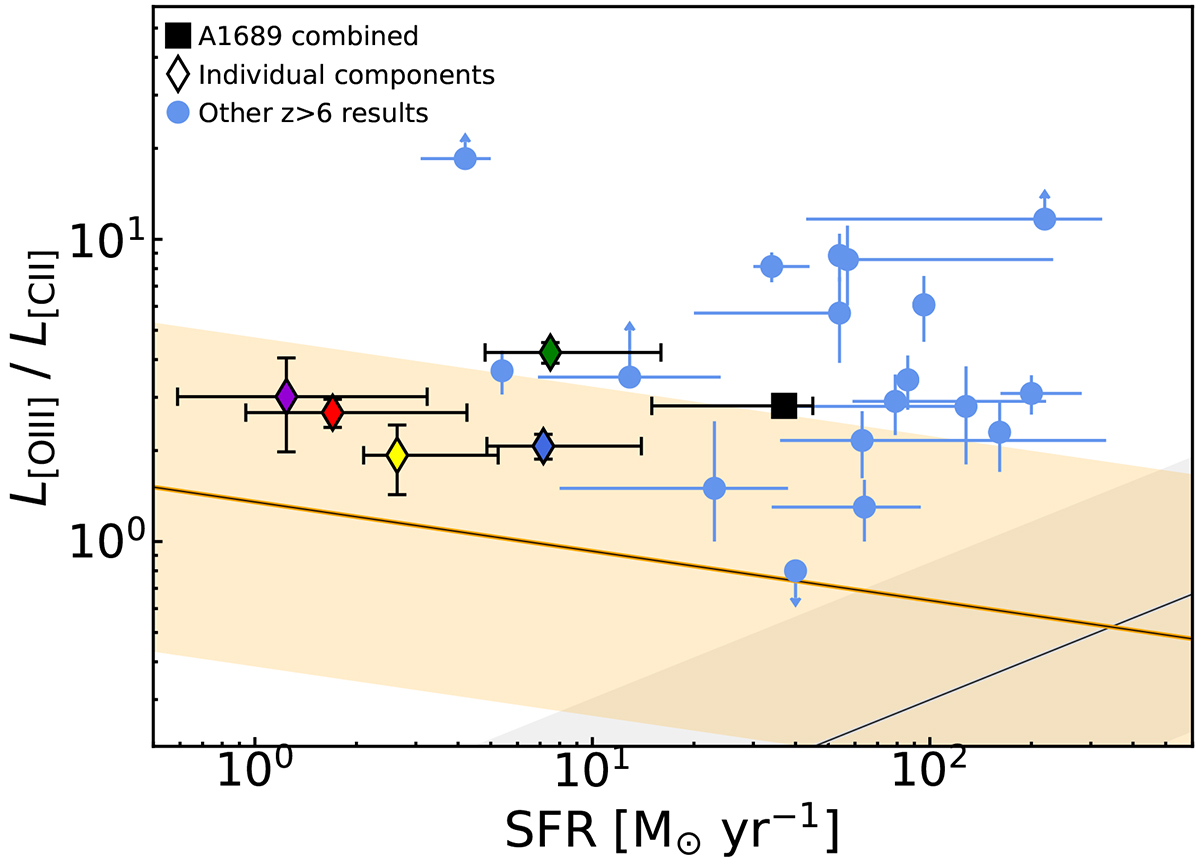
Download original image
Line luminosity ratio of [O III] and [C II] vs. SFR for each component of A1689-zD1 compared to other high-z detections (Inoue et al. 2016; Laporte et al. 2017, 2019; Carniani et al. 2017; Hashimoto et al. 2018, 2019; Tamura et al. 2019; Harikane et al. 2020; Witstok et al. 2022; Algera et al. 2024; Bakx et al. 2024). The diamonds represent the individual components color-coded according to their name, and the star formation is the one derived from the aperture measurements, as given in Tables 6 and 5. The orange and gray region and line indicate the range of the line ratio for local low-metallicity dwarf galaxies and starburst galaxies from De Looze et al. (2014).
Current usage metrics show cumulative count of Article Views (full-text article views including HTML views, PDF and ePub downloads, according to the available data) and Abstracts Views on Vision4Press platform.
Data correspond to usage on the plateform after 2015. The current usage metrics is available 48-96 hours after online publication and is updated daily on week days.
Initial download of the metrics may take a while.