Fig. 14.
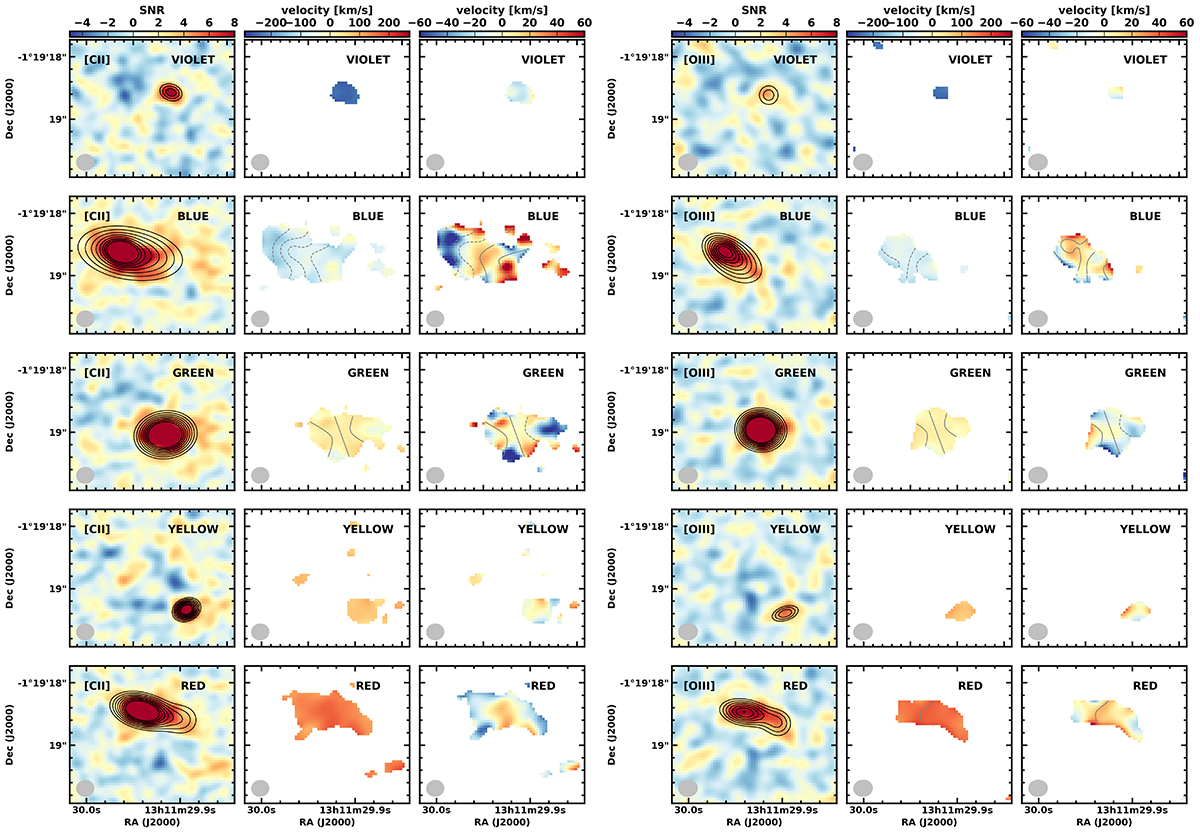
Download original image
Moment-0 and moment-1 maps for each component: [C II] results (left) and [O III] results (right). The models of the other components have been subtracted from the data cube. The left columns show the moment-0 maps integrated over the line of the component; the middle columns the moment-1 given relative to the A1689-zD1 overall velocity field with zero velocity corresponding to z = 7.133; and the right columns the moment-1 map for each individual velocity (same velocity used for both [C II] and [O III]). The overlaid contours represent the fit models, in the moment-0 maps these correspond to 3, 4, 5, 6, 7, 8, 9, and 10σ; in the moment-1 maps, these correspond to velocity in km s−1 in steps of 10 km s−1. The moment-0 maps are given in S/N, where the rms in each map is measured excluding the source region (for [C II]: rms = 5.4, 11.6, 11.5, 6.4, and 8.3 mJy km s−1 beam−1, respectively, and for [O III]: rms = 27.7, 50.8, 54.1, 29.4, and 38.1 mJy km s−1 beam−1, respectively (from top to bottom).
Current usage metrics show cumulative count of Article Views (full-text article views including HTML views, PDF and ePub downloads, according to the available data) and Abstracts Views on Vision4Press platform.
Data correspond to usage on the plateform after 2015. The current usage metrics is available 48-96 hours after online publication and is updated daily on week days.
Initial download of the metrics may take a while.