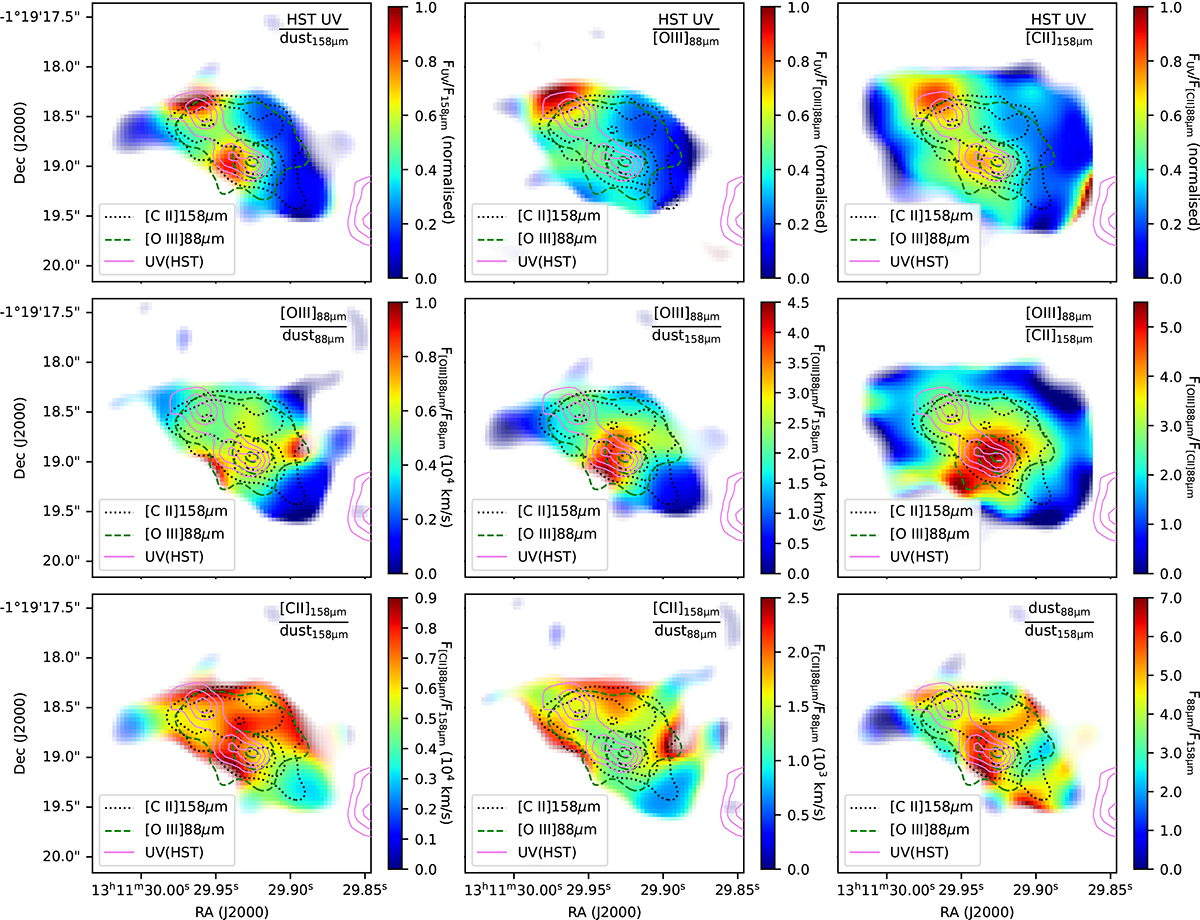
Fig. 15.
Download original image
Ratios of the galaxy’s UV, [C II]158 μm, [O III]88 μm, and dust continuum emission. The images are convolved to the smallest common beam: the [O III] beam where those data are involved and the [C II] beam otherwise. Parts of the ratio maps with S/N below 3 in the denominator are masked white, with increasing transparency from 3 to 6. The color range is normalized across the S/N > 6 part of the map for the panels involving the HST data. Contours for the [C II] and [O III] line emission and the UV emission are shown as dotted black, dashed green, and solid violet lines.
Current usage metrics show cumulative count of Article Views (full-text article views including HTML views, PDF and ePub downloads, according to the available data) and Abstracts Views on Vision4Press platform.
Data correspond to usage on the plateform after 2015. The current usage metrics is available 48-96 hours after online publication and is updated daily on week days.
Initial download of the metrics may take a while.