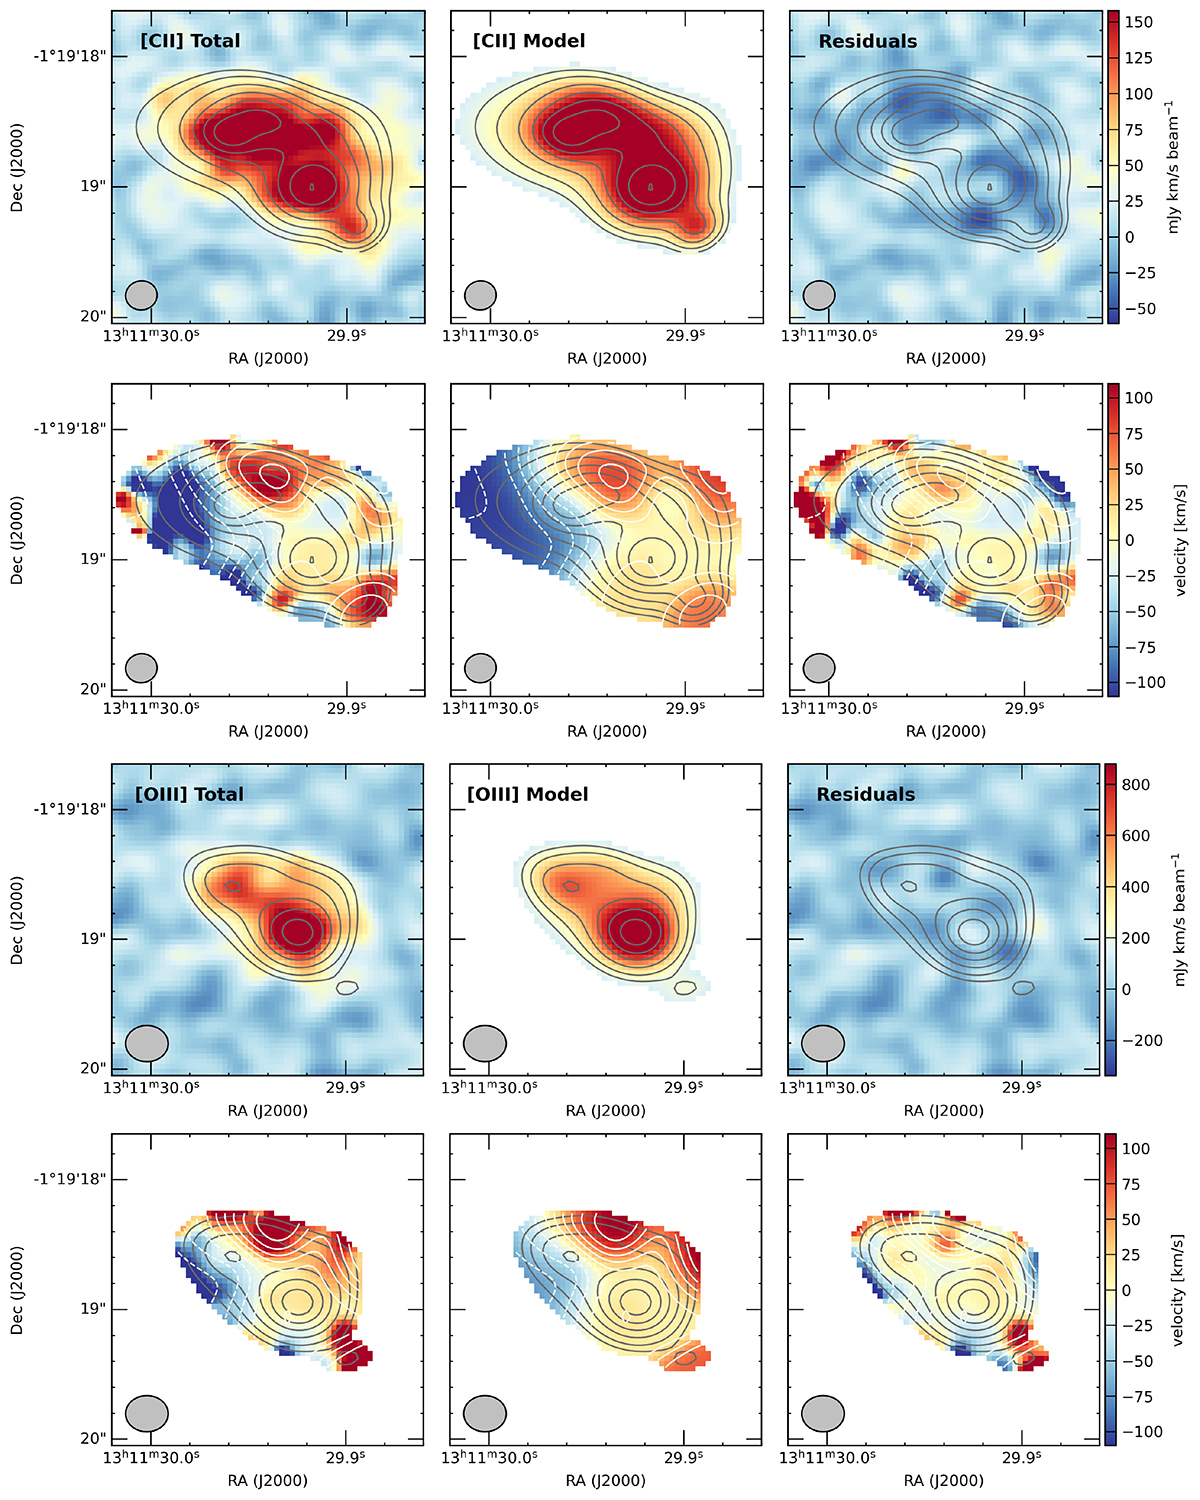
Fig. 6.
Download original image
Overall moment-0 maps (first and third rows) and moment-1 maps (second and fourth rows) for A1689-zD1 for [C II] and [O III] for the data (left), the model (middle), and the residuals (right). Contours show the model with the gray showing the moment-0 (3, 4, 5, 7, 10, 13, 16, and 19σ, where the rms is measured in the data regions excluding the source), and the white contours showing the moment-1 in steps of 20 km s−1. The applied mask is determined from the model. We note that this does not include the extended “halo” component presented in Akins et al. (2022).
Current usage metrics show cumulative count of Article Views (full-text article views including HTML views, PDF and ePub downloads, according to the available data) and Abstracts Views on Vision4Press platform.
Data correspond to usage on the plateform after 2015. The current usage metrics is available 48-96 hours after online publication and is updated daily on week days.
Initial download of the metrics may take a while.