Open Access
Fig. 8.
Download original image
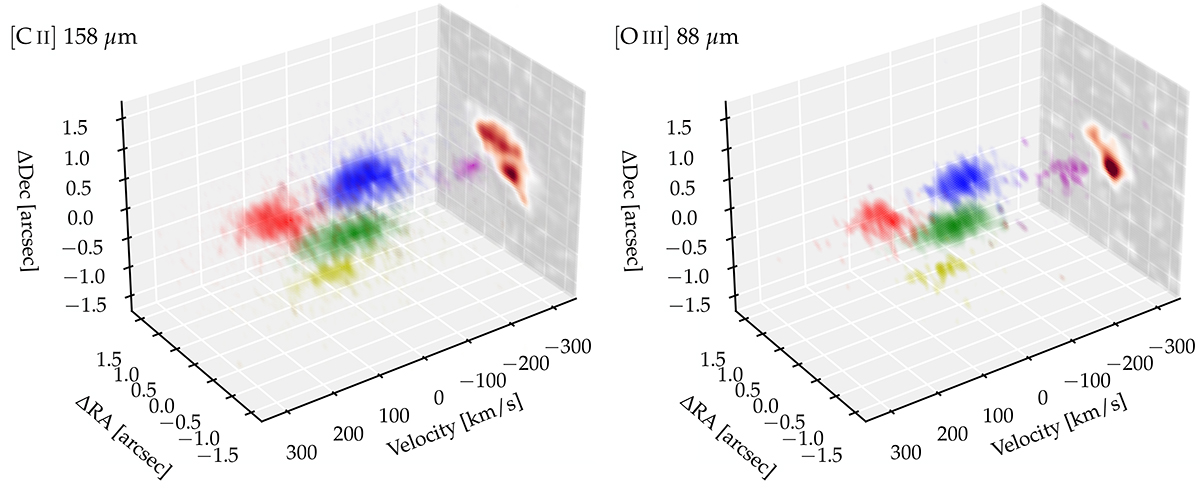
Decomposed components of the observations of A1689-zD1 shown in 3D with color-coding according to component name. The integrated moment-0 maps is shown at the end of the plot.
Current usage metrics show cumulative count of Article Views (full-text article views including HTML views, PDF and ePub downloads, according to the available data) and Abstracts Views on Vision4Press platform.
Data correspond to usage on the plateform after 2015. The current usage metrics is available 48-96 hours after online publication and is updated daily on week days.
Initial download of the metrics may take a while.