Fig. 9.
Download original image
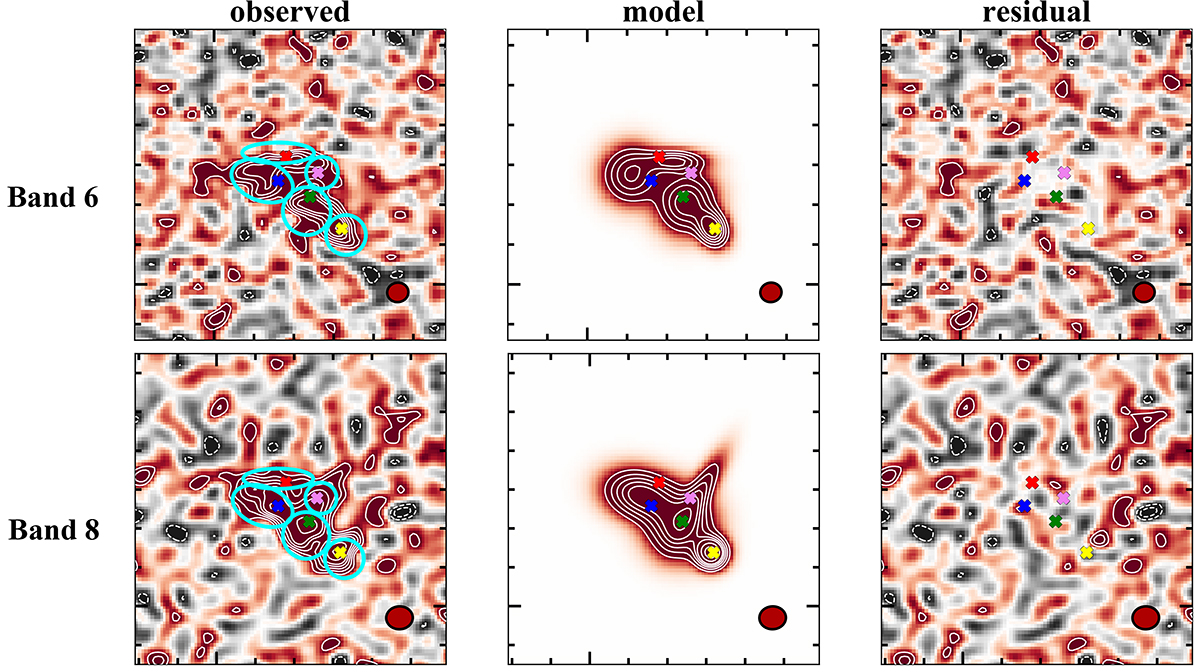
Decomposition of the band 6 (about 158 μm, top) and band 8 (about 88 μm, bottom) dust continuum for the five components. The 4″ × 4″ cutouts of the observed, IMFIT model, and residual maps are presented from left to right. The solid and dashed contours show the intensity at the 2, 3, 4, 5, 6, 8, and 10σ levels and −3 and −2σ levels, respectively, which are measured based on the residual map. The spatial position of the five [O III] components are marked with the color crosses. The cyan circles indicate the elliptical apertures that are used for the aperture photometry.
Current usage metrics show cumulative count of Article Views (full-text article views including HTML views, PDF and ePub downloads, according to the available data) and Abstracts Views on Vision4Press platform.
Data correspond to usage on the plateform after 2015. The current usage metrics is available 48-96 hours after online publication and is updated daily on week days.
Initial download of the metrics may take a while.