Open Access
Fig. 2
Download original image
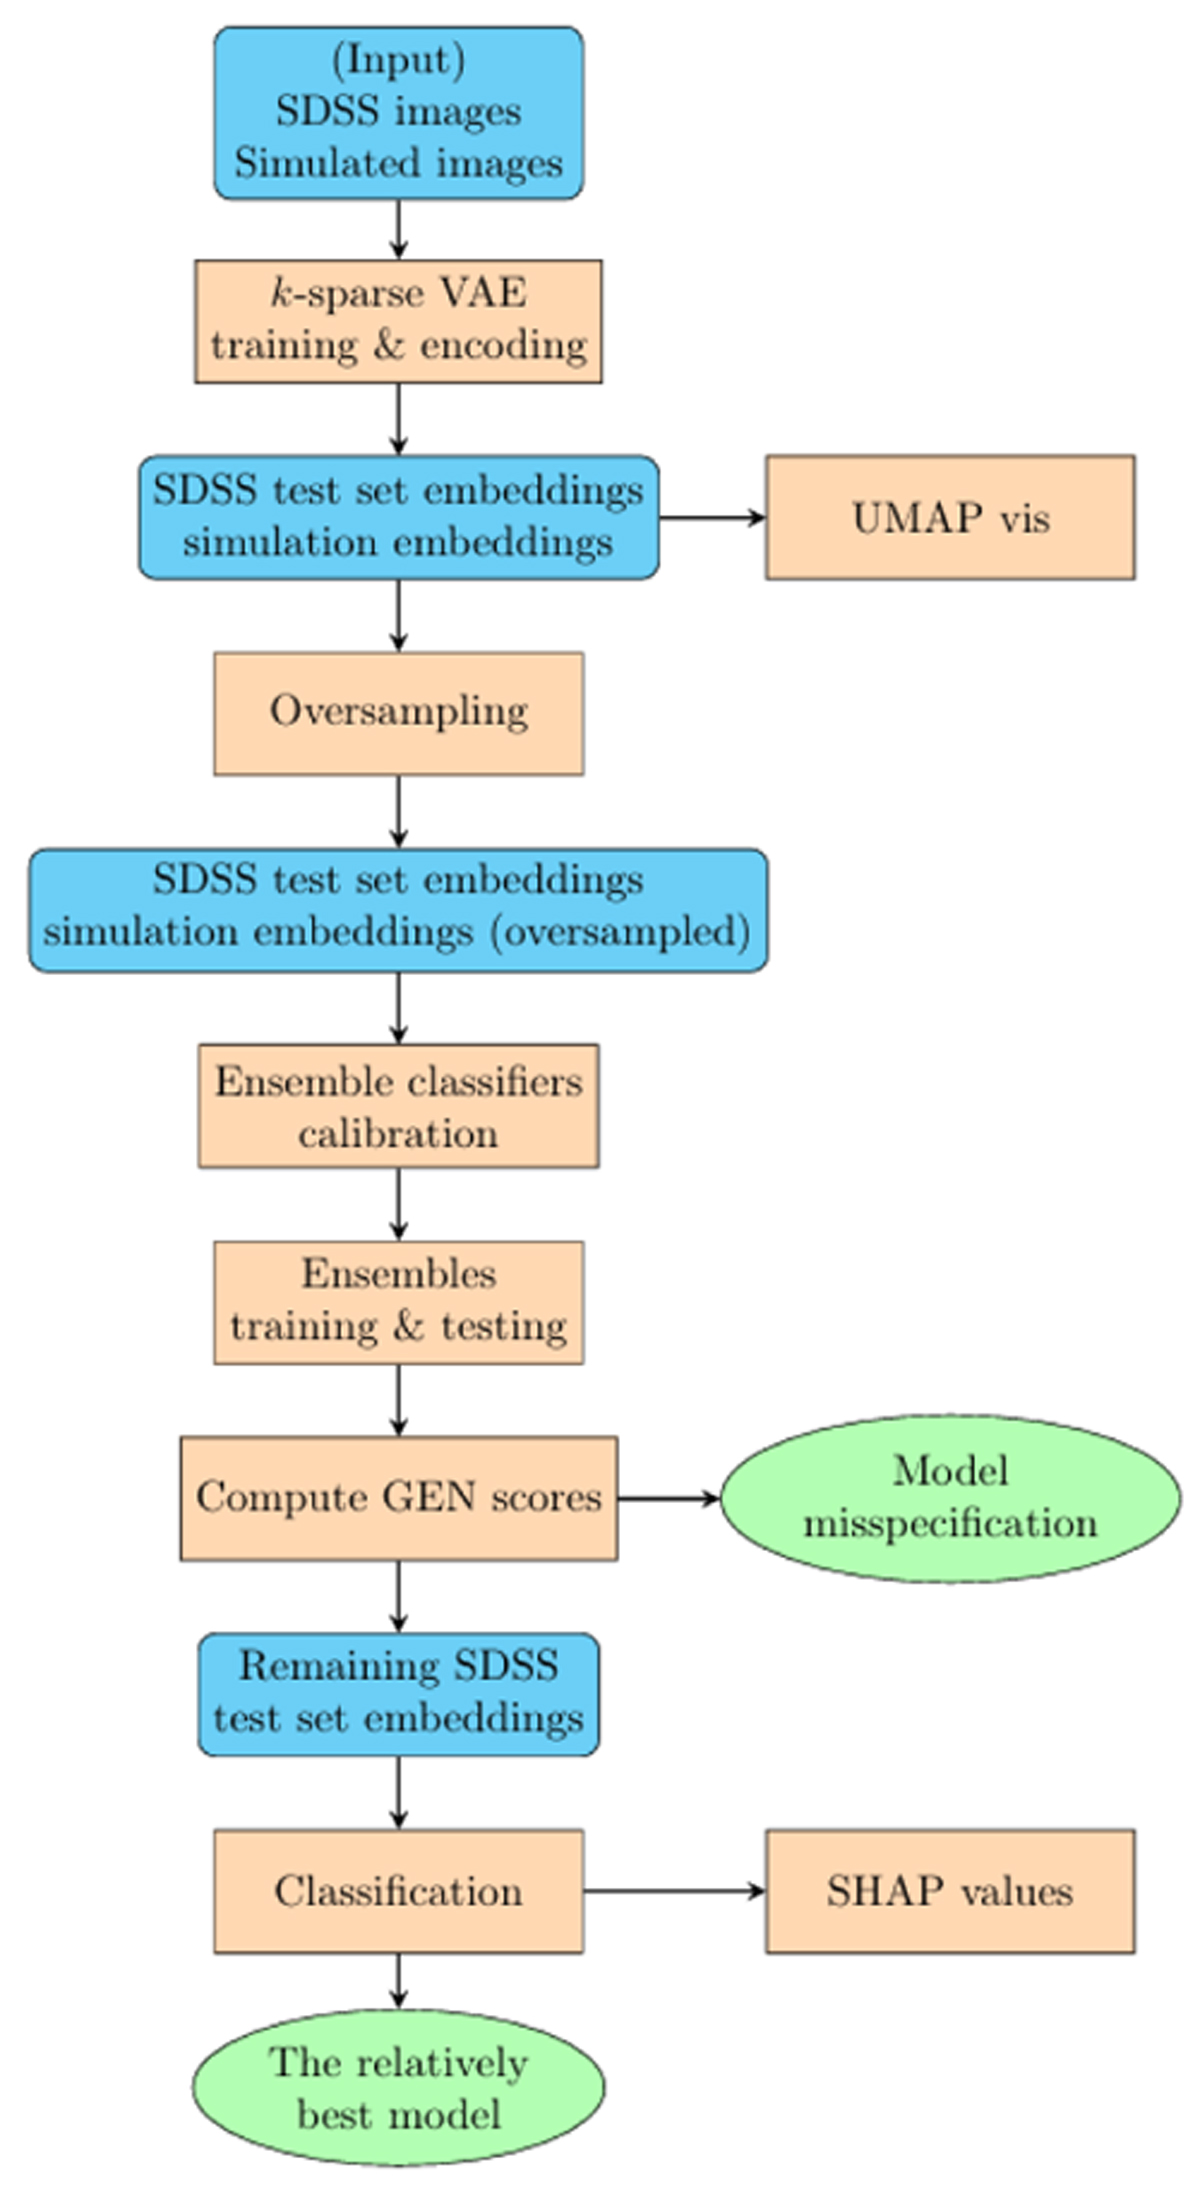
Flow chart of our workflow pipeline. The blue boxes with rounded corners represent the data products of the previous step. The grange boxes show the main algorithmic steps in our method. The green ellipses represent output results.
Current usage metrics show cumulative count of Article Views (full-text article views including HTML views, PDF and ePub downloads, according to the available data) and Abstracts Views on Vision4Press platform.
Data correspond to usage on the plateform after 2015. The current usage metrics is available 48-96 hours after online publication and is updated daily on week days.
Initial download of the metrics may take a while.