Open Access
Fig. 6
Download original image
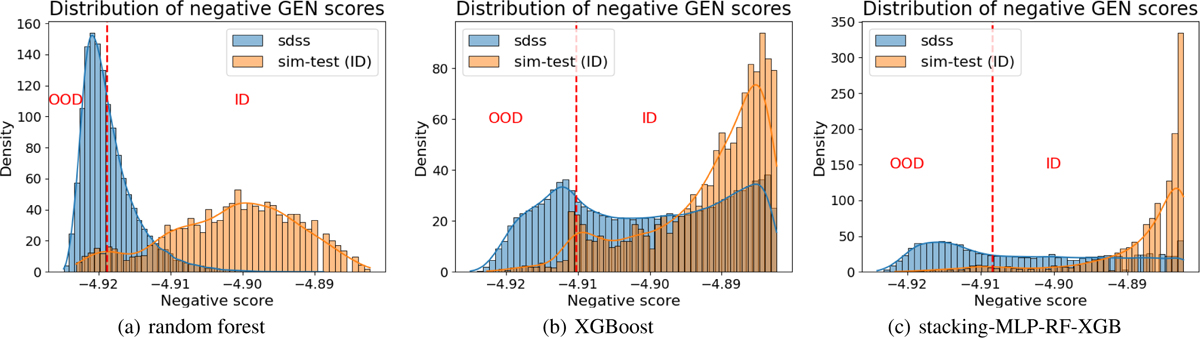
GEN score distribution of all simulation model test sets (orange) and the SDSS test set (blue). Left: random forest. Middle: XGBoost. Right: stacking-MLP-RF-XGB. The vertical red line represents the 95% threshold. The region to its right corresponds to in-distribution data, and the region to its left indicates OOD data.
Current usage metrics show cumulative count of Article Views (full-text article views including HTML views, PDF and ePub downloads, according to the available data) and Abstracts Views on Vision4Press platform.
Data correspond to usage on the plateform after 2015. The current usage metrics is available 48-96 hours after online publication and is updated daily on week days.
Initial download of the metrics may take a while.