Fig. 8
Download original image
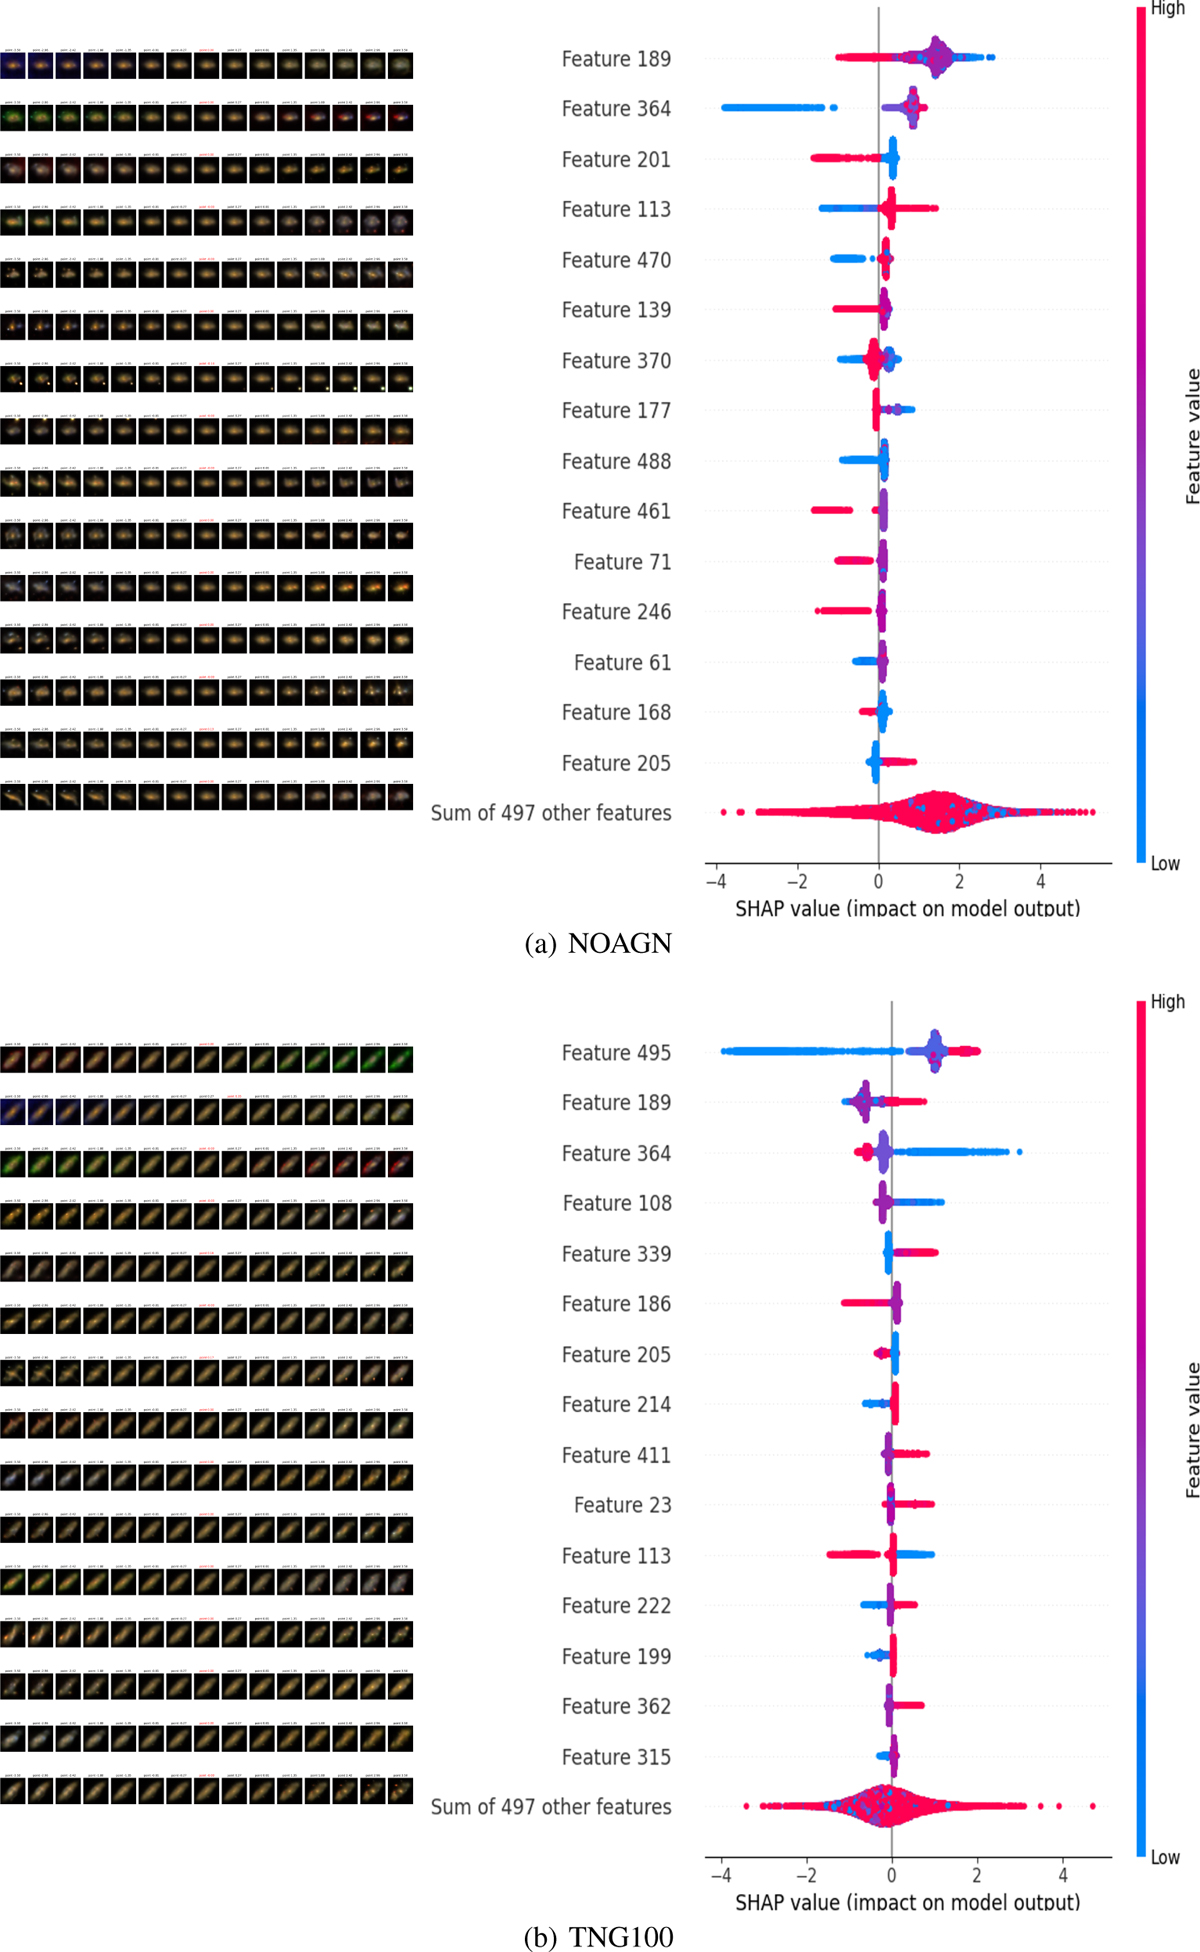
SHAP plots for the XGBoost classifier. Top: NOAGN. Bottom: TNG100. Left: visualization of the generated galaxy images in which a single feature value is varied in each column. The middle column indicated by a red title shows the reconstruction from an encoded latent embedding of an example galaxy. To the left(right) we reduce (increase) the value of that entry in the latent embedding varying it by ∼ 3σ around the mean in each dimension. Right: n-th feature dimension of the latent embeddings ordered by their importance on the prediction of the XGBoost classifier result. The x-axis shows the SHAP value, i.e. the impact of that feature on the prediction while the color coding shows the feature value, e.g., high (red) vs. low (blue)feature values. Each point in the distribution refers to an individual prediction from the test set. For example, features 189 (top) and 495 (bottom) show strong color variation while features 470 (top) and 205 (bottom) show strong structural variation.
Current usage metrics show cumulative count of Article Views (full-text article views including HTML views, PDF and ePub downloads, according to the available data) and Abstracts Views on Vision4Press platform.
Data correspond to usage on the plateform after 2015. The current usage metrics is available 48-96 hours after online publication and is updated daily on week days.
Initial download of the metrics may take a while.